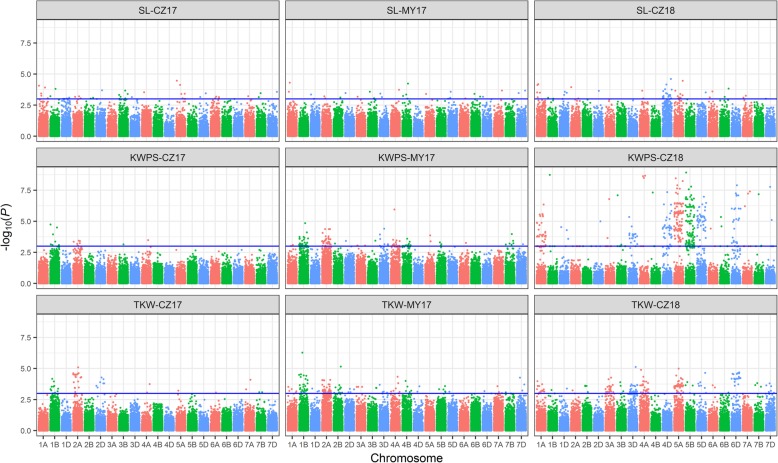
Fig. 5.
The P values of associated loci with yield-related traits under stripe rust stress exhibited as Manhattan plots. The associated loci with SL, KWPS and TKW in three test environments were displayed as Manhattan plots with P values across 21 wheat chromosomes. The significant associated loci were considered as –log10(P) > 3 which upper the blue lines. SL, Spike length; KWPS, Kernel weight per spike; TKW, Thousand-kernel weight. CZ17 = Chongzhou 2017; MY17 = Mianyang 2017; CZ18 = Chongzhou 2018

