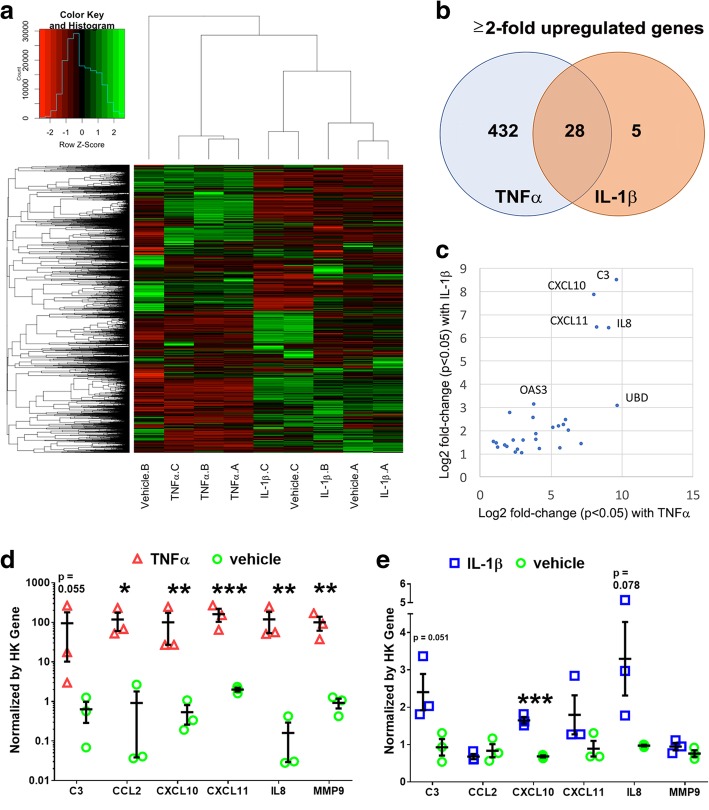
Fig. 3.
RNA sequencing reveals TNFα and IL-1β treatment result in the activation of neuroinflammatory genes with different effect sizes. a Unsupervised hierarchical clustering of the whole transcriptome of TNFα-, IL-1β-, and vehicle-treated differentiated astrocytes clusters TNFα samples by treatment. In contrast, the majority of IL-1β samples cluster more closely to the same passage vehicle control. b Venn diagram of ≥ + 2-fold change reveals differential gene activation effect sizes but overlapping upregulated genes by TNFα and IL-1β treatment. c Genes highly upregulated by either TNFα or IL-1β treatment have neuroinflammatory functions. d Independent verification of a cohort of six TNFα activated genes by qRT-PCR expression screening following 7 days TNFα treatment. e Independent qRT-PCR expression screening of the same six gene cohort following 7 days IL-1β treatment. Although IL-1β results in elevated mRNA levels for all six genes relative to control, the magnitude of increased expression is considerably reduced when compared to the TNFα qRT-PCR dataset (note log10 scale for TNFα compared to linear scale for IL-1β data). *** p < 0.001, **p < 0.01, *p < 0.05 unpaired Students t test, one-way ANOVA with Sidak’s multiple comparisons test n = 3. Data are presented as mean ± SD

