Fig. 3.
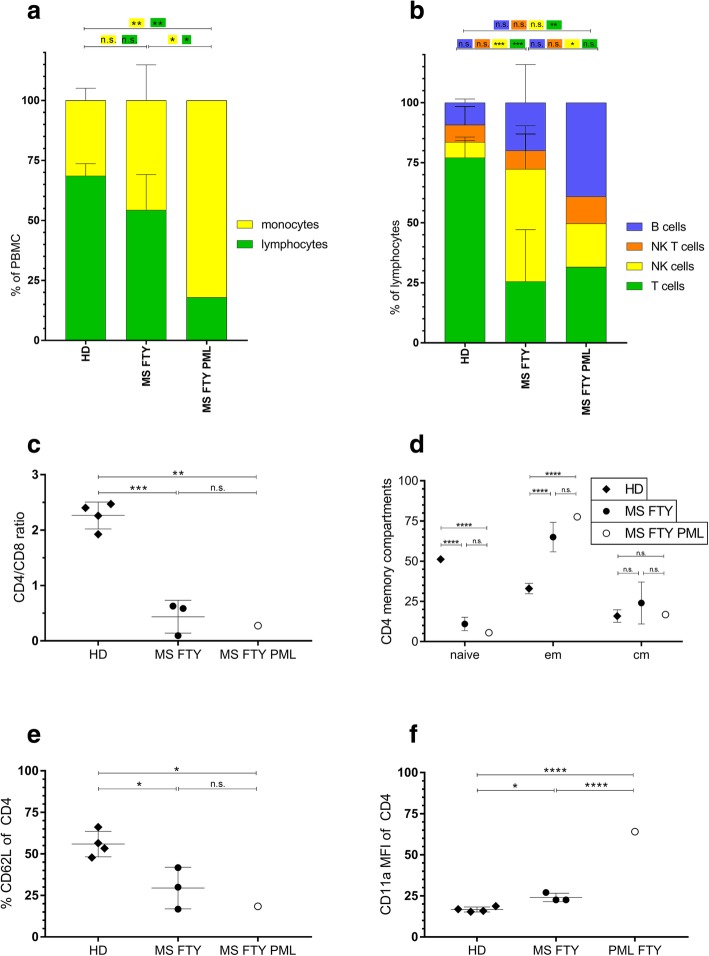
Flow cytometry of peripheral blood-derived mononuclear cells. Peripheral blood mononuclear cells (PBMC) of the patient at the time point of PML diagnosis were analyzed using ten color flow cytometry and compared to four healthy donors (HD) and three Fingolimod-treated control MS patients. (a) The proportions of monocytes (CD14+) and lymphocytes (CD3+) among all viable PBMC. (b) Proportions of B- (CD19+), NK- (CD56+), NK T- (CD56+, CD3+), as well as T- (CD56-, CD3+) cells of all viable lymphocytes. (c) The ratio of CD4+ to CD8+ T cells of all CD3+ T cells. (d) Proportions of naïve (CD62L+, CD45RA+), central-memory (CD62L+, CD45RA-) and effector-memory (CD62L-, CD45RA-) CD4+ T cells. (e) Percentage of CD62L+ cells of viable CD4+ T cells. (f) Mean fluorescence intensity of CD11a on viable CD4+ T cells. Two-way ANOVA with Tukey’s multiple comparisons test was performed for (a, b and d). One-way ANOVA with Tukey’s multiple comparisons test was performed for (c, e and f). * = p < 0.05; ** = p < 0.01; *** = p < 0.001; **** = p < 0.0001

