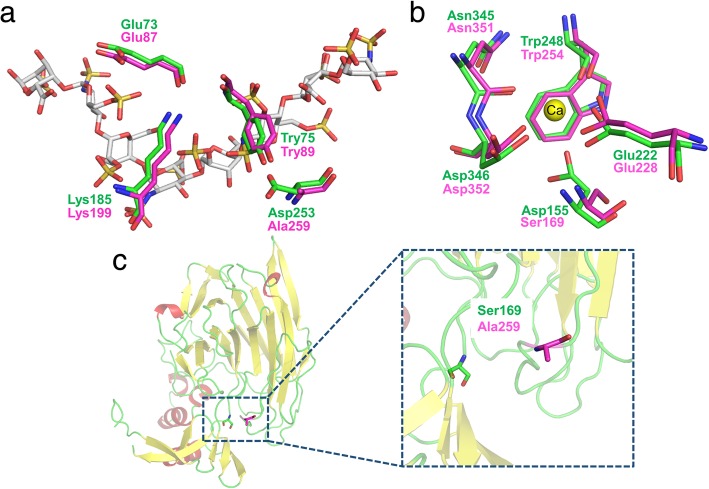
Fig. 3.
Substrate recognition and calcium ion binding interaction sites. (a) The substrate is shown as sticks in gray. Residues from template and Ph-HepI are shown in green and magenta, respectively. (b) The calcium ion is shown as a yellow sphere. Residues from template and Ph-HepI are shown in green and magenta, respectively. (c) Cartoon representation of the structure model of Ph-HepI. The two residues (Ser169 and Ala259) in the Ph-HepI are indicated by markers in green and magenta, respectively. Two amino acids in Ph-HepI are different from template (Ser169, Ala259)

