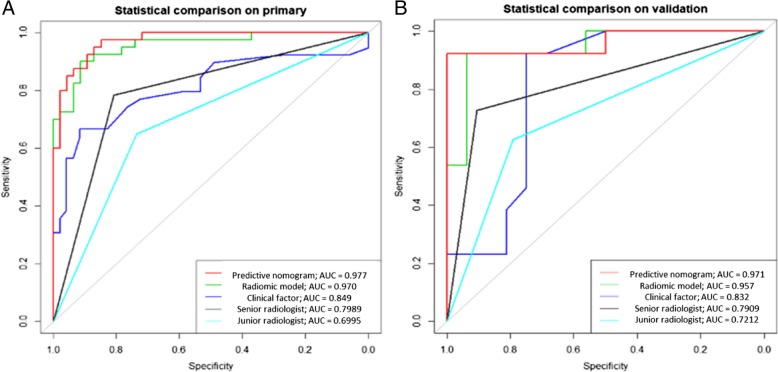
Fig. 5.
Receiver operating characteristic curve analysis of the models and radiologists’ diagnoses on the primary cohort (a) and validation cohort (b). The red, green, dark, black, and light blue lines denote the results of radiomic nomogram, radiomic model, clinical factors, a senior radiologist, and a junior radiologist, respectively

