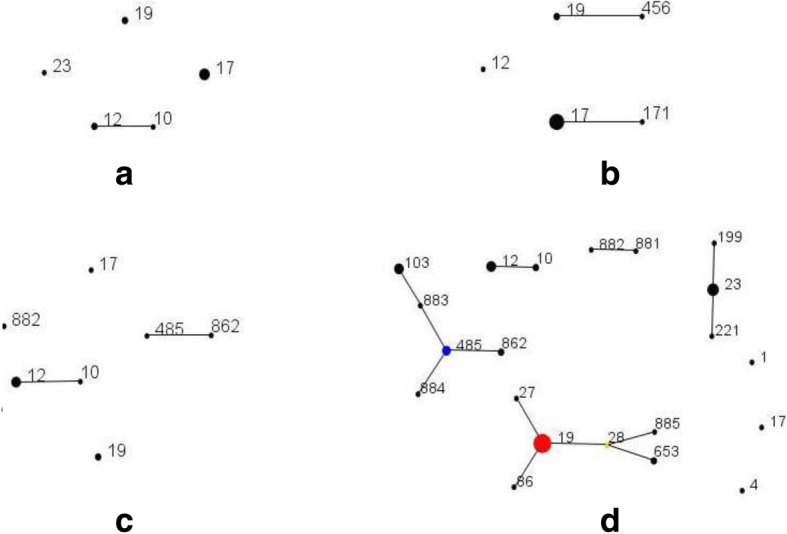
Fig. 1.

Minimum spanning tree (MST) analysis of four populations of GBS isolates according to sequence type (ST). a EOGBS; b LOGBS; c NCGBS; d MCGBS. In the MST, circles represent the STs, and the areas of each of circles indicate the prevalence of the ST in the input data. Lines are used to show the radial links from the founder to each of its single-locus variants (SLVs). The primary founder of a group is defined as the ST that differs from the largest number of other STs at only a single locus, and it is coloured blue. The user-selected primary founder is coloured red. A ST that appears to have diversified to produce multiple SLVs is called a subgroup founder, which is coloured yellow
