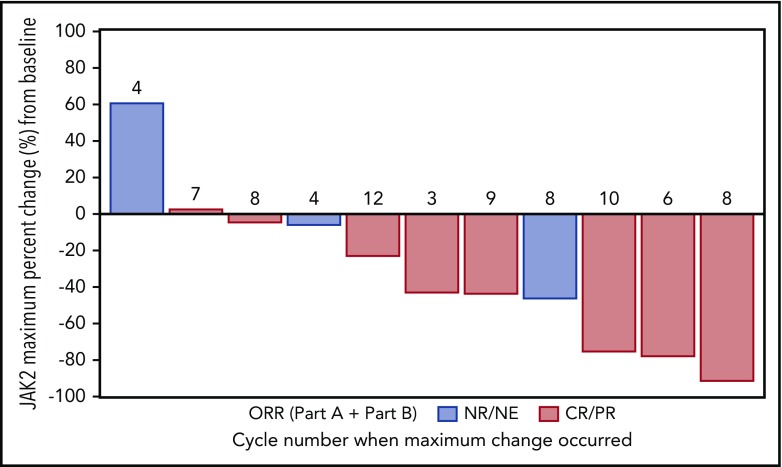
Figure 4.
JAK2 driver mutation response with idasanutlin therapy. The waterfall plots demonstrate the spectrum of molecular responses observed with idasanutlin therapy, and the cycle in which the maximal reduction in VAF was first noted is shown in association with the response bar. NE, not evaluable; NR, no response.

