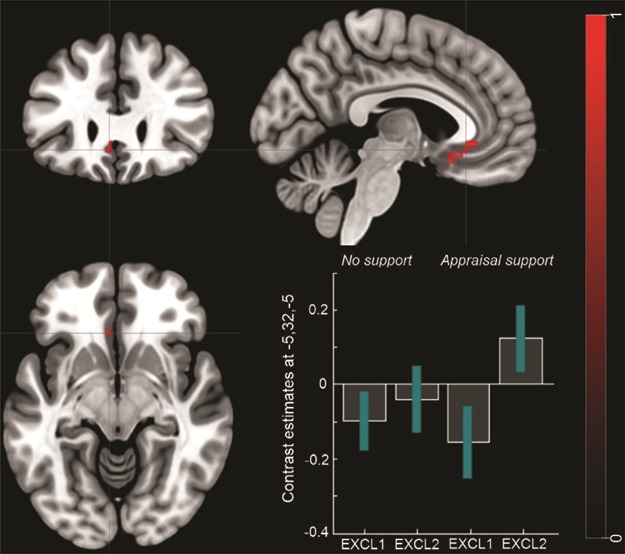
Fig. 6.

FMRI results. Differences in the neural activation between the appraisal support group vs the no support group for the contrast: social exclusion run 2 > social exclusion run 1. The bar plots represent contrast estimates and 90% confidence intervals in the subACC. For illustrative purposes, statistical maps are displayed with a threshold of P < 0.001 uncorrected and superimposed on a standard T1 template.
