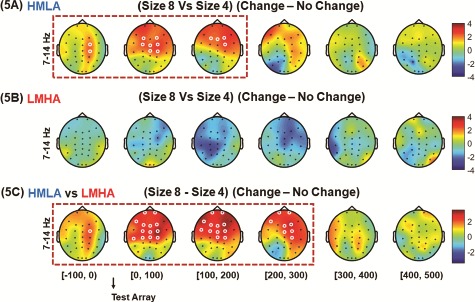
Fig. 5.

HHT time–frequency spectrum of CDT on difference of power from set size 8 to set size 4. Analysis was carried out with data for all trials time-locked to the onset of the test array. For category 3 comparisons, the contrast between set size 8 and set size 4 for differences in power between change and no change trials was performed for HMLA (A) and LMHA (B) groups. Furthermore, a contrast between the two groups was also performed on difference in power between change trials and no change trials as well as difference in set size 8 and set size 4 (C). (The white circles indicate the regions of significance, P < 0.05 CBnPP).
