
Fig. 3.
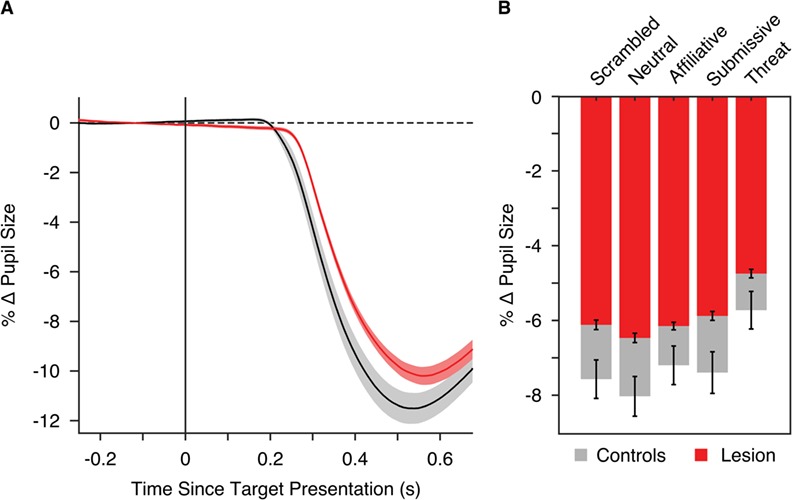
Results of the pupilometry analyses from Study 2 examining pupil response in monkeys are displayed here. (A) Time courses of change in pupil size are shown for the lesion (red) and control (gray) groups [baseline normalized to the 250 ms before trial onset (at 0 ms)] averaged across face part. The shaded regions indicate ±1 SEM. (B) Mean percent change in pupil size from 400 to 700 ms following trial onset is presented for each group split by distractor category. Error bars indicate ±1 SEM.