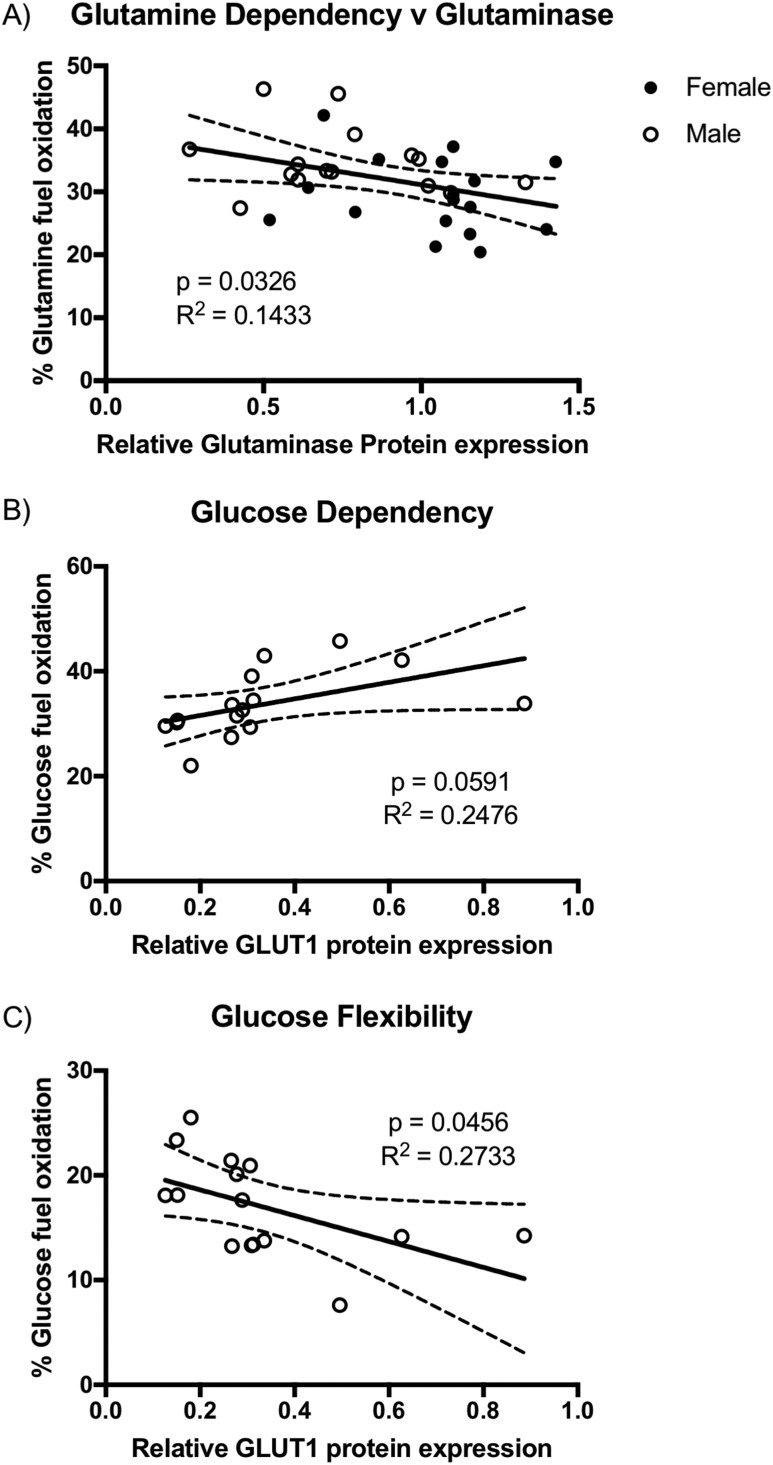
Figure 5.
(A–C) Relationship of (A) trophoblast glutaminase expression and glutamine dependency with male (n = 15) and female (n = 17) trophoblast combined, (B) glucose dependency and GLUT1 expression, and (C) glucose flexibility and GLUT1 expression, both in male trophoblast only (n = 15). A significant negative correlation of glutamine dependency with glutaminase expression (P < 0.05), a positive correlation of glucose dependency with GLUT1 (P = 0.059), and a negative correlation of glucose flexibility with GLUT1 expression (P < 0.05) were found.

