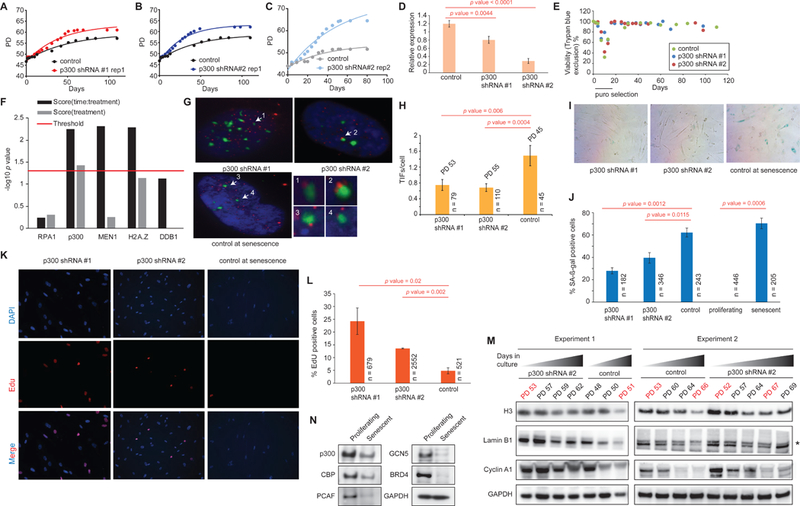
Figure 2: Validation studies with p300 hairpins that emerged as potential candidates from the RNAi screen.

(A-C) RLS curves of cells harboring hairpins targeting p300 or a control. (D) qPCR showing KD efficiency of p300 hairpins relative to a housekeeping gene. (E) Representative viability plot during an RS assay with cells harboring p300 KD using trypan blue exclusion. (F) Plot showing p values of lifespan experiments in (A-C) and Figure S2A-X using a repeat measure analysis. The red line indicates the threshold for significance (p=0.05). (G) IF images showing TIF formation in cells harboring a control or p300 hairpin. TIFs (arrow) are assigned if there is co-localization of 53BP1 (green) and Cy3-labeled telomere end (red). Insets show a magnified view of the TIFs. (H) The number of TIFs per cell are counted and plotted. (I) Representative SA-β-gal staining in cells harboring control or p300 hairpins. (J) The number of β-gal positive cells represented as a percentage of total counted cells. (K) IF images showing EdU incorporation in cells harboring a control or p300 hairpin. (L) The percentage of EdU incorporation is estimated by counting the percentage of cells (DAPI, blue in K) that are stained with EdU (red in I) and plotted as a bar plot. (M) Western blots from 2 independent RLS experiments showing the downregulation of histone H3, lamin B1 and cyclin A1 during passage to senescence of cells harboring either p300 or control hairpin. Note that at comparable PDs (indicated in red), cells that are depleted in p300 retain more H3, lamin B1 and cyclin A1 compared to control. (N) Western blots showing protein levels of multiple HATs in proliferating and senescent cells including CBP and p300. n = number of cells scored, p value estimates are from unpaired t-tests.
