
Figure 3: Histone peptides are hyper-acetylated in senescence.
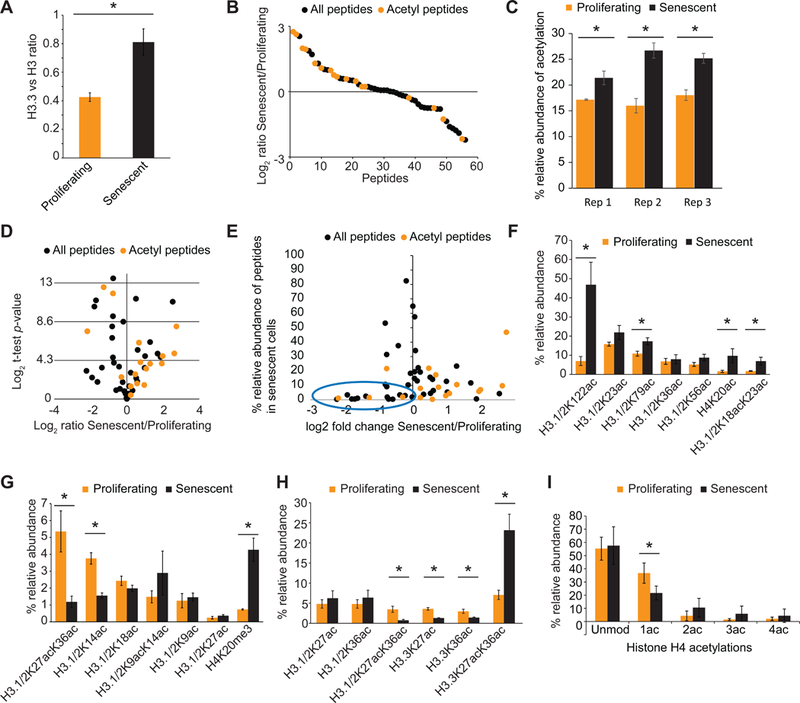
(A) Ratio of H3.3 to H3 increases in senescence as previously reported. (B) Ranked enrichment of all histone peptides detected by mass spec are plotted. Many acetylated peptides (red) are enriched in senescence compared to other peptides (black). (C) The relative abundance of acetylated peptides in RS is significantly higher than in proliferating cells in all 3 biological replicate samples. (D) Volcano plot (fold enrichment vs significance) of peptides in 3 replicate mass spec experiments. Peptides above y = 4.3 represent significantly altered peptide abundances. (E) Fold change vs abundance graph showing that acetylated peptides that are decreased in senescence have very low abundance (blue oval). (F) Relative abundance of several acetylated H3.1 peptides that increase in RS. (G) Relative abundance of acetylated H3.1/H3.2 peptides that decrease in RS. H4K20me3 is a positive control. (H) Relative abundance of several acetylated H3.1/3.2 and H3.3 peptides that are altered in RS. Note that H3.1/H3.2K27acK36ac decreases while H3.3K27acK36ac increases significantly upon senescence establishment. (I) Plot showing the abundance of single and multiple acetylations on the H4 4–17 peptide. Note that single acetylations decrease significantly with a shift towards multiple acetylated forms. Asterisk indicates a p<0.05 as assessed by unpaired t-test across 3 biological replicate experiments. Proliferating cells were at PD 26, 31 and 34 while senescent cells at PD 75, 75 and 78.