
Figure 5: Senescence-Activated SEs correlate with senescence-related gene expression.
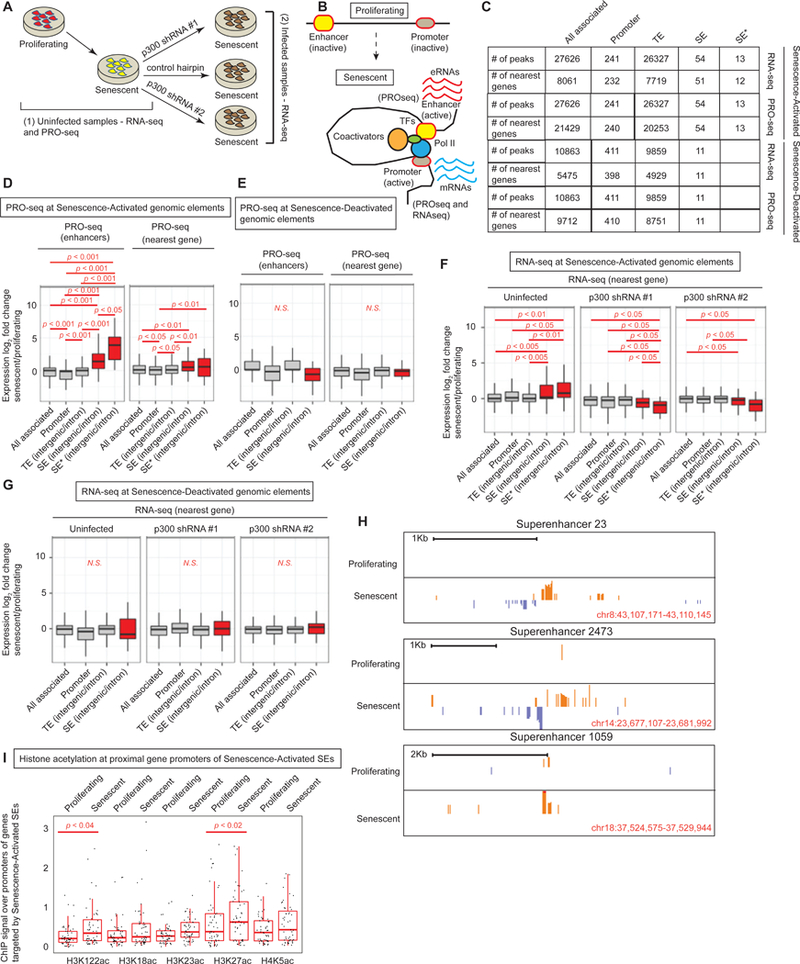
(A) Schematic showing samples for RNA- and PRO-seq libraries; (1) from proliferating and senescent uninfected cells and (2) senescent cells harboring control or p300-targeting hairpins. (B) Schematic showing the licensing of new enhancers in senescence with chromatin looping, engagement of transcription machineries and production of eRNAs and mRNAs. (C) Table showing the numbers of genomic elements (all, promoter, TE, SE and SE*) and their target genes used to draw box plots in D-G in proliferating and senescence conditions. SE* represents SEs with multiple acetylations. (D) Box plot of fold change of PRO-seq signal (senescence vs proliferating) across different genomic elements in senescence (TE, SE and SE*) measured at the enhancers (left) and the nearest target gene (right). (E) Same as (D) except the genomic elements are called in proliferating cells. (F) Box plot of fold change of RNA-seq signal (senescence vs proliferating or control vs KD) across different genomic elements called in senescence. (G) Box plot of fold change of RNA-seq signal (senescence vs proliferating) across different genomic elements called in proliferating cells. (H) Browser track views of PRO-seq signal at 3 SEs. 2-tailed Mann-Whitney-Wilcoxon Test was used to compare bins within and between boxplots. (I) ChIP signal of various histone acetylations at the promoters of the nearest genes identified as targets of the Senescence-Activated SEs. For PRO-seq, proliferating cells were at PD 20 and senescent cells at PD 76. For RNA-seq, proliferating cells were at PD 29 and 34 while senescent cells were at PD 78 and 79.