Figure 1.

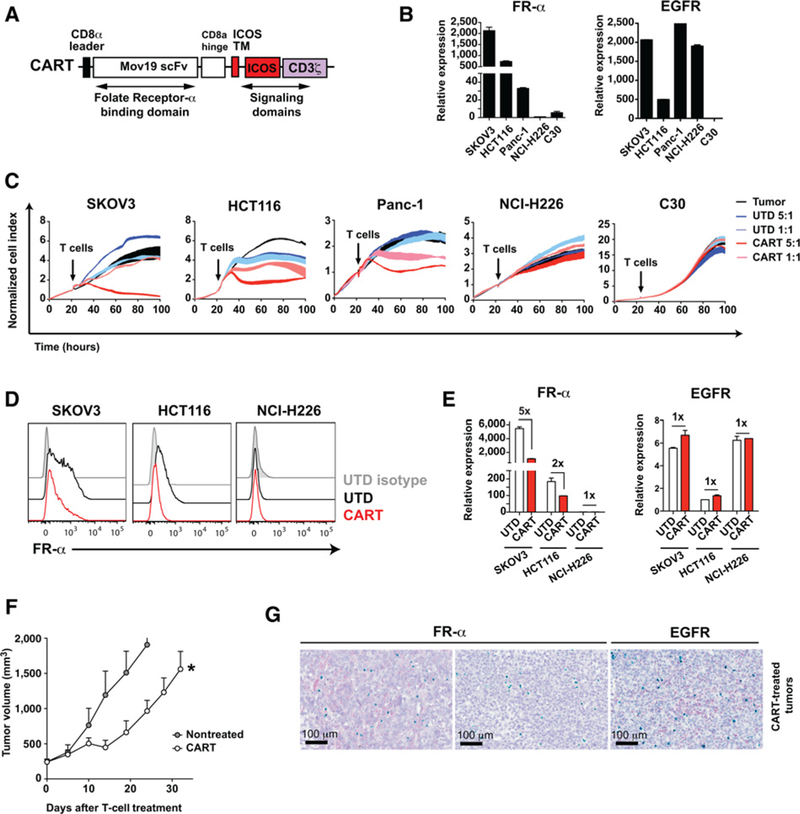
Tumors escape CART-cell therapy against FR-α by selection of antigen-negative populations. A, Schematic representation of the FR-CAR. The CAR consists of Mov19scFvthat binds to FR-α, the ICOS transmembrane (TM) and intracellular domains, and the human CD3Z chain. B, Expression of FR-α and EGFR was measured by qRT-PCR for the indicated cell lines. The mean ± SD of triplicates is shown. C, A real-time cytotoxicity assay (xCelligence) was used to evaluate the lysis of the indicated tumor cells when treated with control cells (UTD) or CART cells at the indicated E:T ratios over a 100-hour period. D and E, Tumor cells were cocultured with UTD or CART cells (E:T = 3:1). After 24 hours, FR-α and EGFR expression was analyzed in surviving tumor cells by (D) flow cytometry or (E) qRT-PCR to detect relative expression of FR-α and EGFR for the indicated cell lines in the presence or absence of CART cells. The mean ± SD from two independent experiments is shown. F and G, NSG mice bearing SKOV3 tumors were left untreated or treated with two intravenous injections of 4 × 10⁶ CART cells (n = 5 per group). F, Tumor volume was monitored. The mean tumor volume ± SEM is shown. Representative results from two independent experiments are shown. *, P < 0.05 by two-way ANOVA with Tukey post hoc test. G, Tumors were obtained at the end point and FR-α (red), EGFR (red), and CD3 (green) expression in tumors was analyzed by RNAscope. Representative images from the CART cell-treated group are shown. Two different areas of the same tumor are shown for FR-α. EGFR expression in an area negative for FR-α expression in consecutive sections is shown.
