Figure 5.

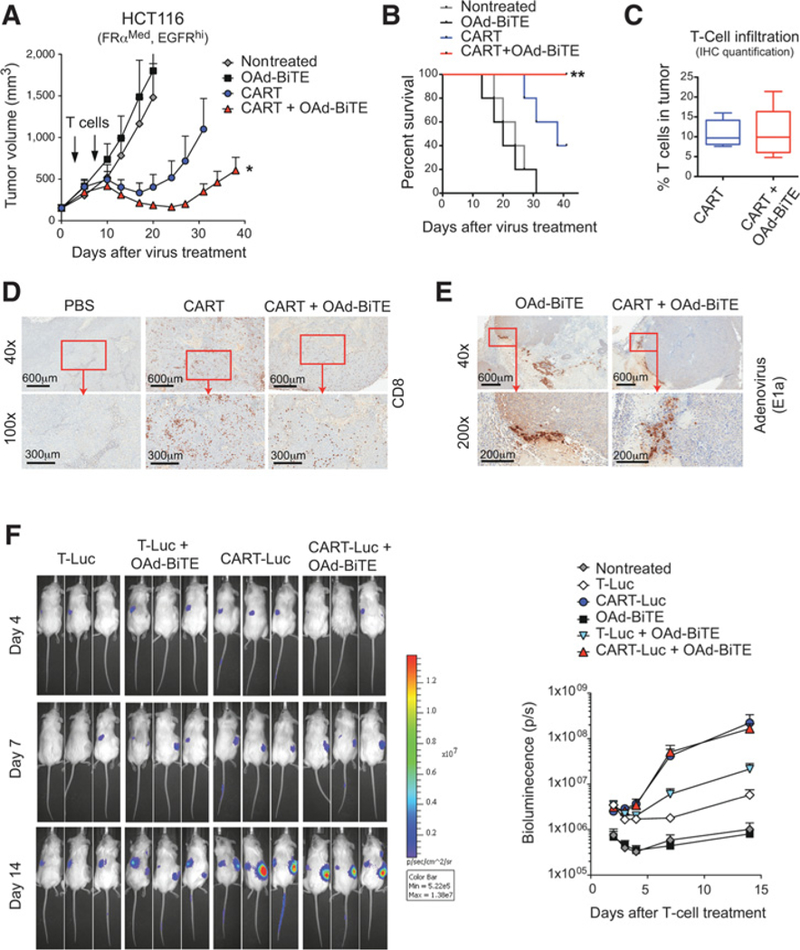
Combination of OAd-BiTE and CART cells shows synergistic antitumor effects in vivo. A–E, NSG mice bearing 15-day established HCT116 tumors were treated with OAd-BiTE (1 × 10⁹vp) or PBS. 3 and 7 days after virus treatment, animals were treated with 10 × 106 CART cells. A, The mean tumor volume ± SEM (n = 5 per group) is plotted. *, P< 0.05 by two-way ANOVA with Tukey post hoc test B, Kaplan-Meier survival curves of the experiment described in A. Representative of two independent experiments. **, P < 0.01 by long-rank (Mantel-Cox) test. C, The immune infiltrate in the tumors described in A was evaluated by immunohistochemistry for human CD8+ T cells at day 41 after treatment. The percentage of nuclei that stained positive for CD8+ T cells in the tumor was quantified. Representative images for (D) CD8 and (E) adenovirus immunohistochemical stains are shown. F, T-cell accumulation in HCT116 tumors. NSG mice bearing HCT116 tumors were treated with OAd-BiTE (1 × 10⁹vp) or PBS. Three and 10 days after virus treatment, animals were left untreated or treated with an intravenous injection of 10 × 106 control T-Luc cells (40% CBG+) or CART-Luc cells (50% CAR+, 40% CBG+). A total of 5 mice per group were used for the indicated treatments. Bioluminiscence was analyzed at the indicated time points.
