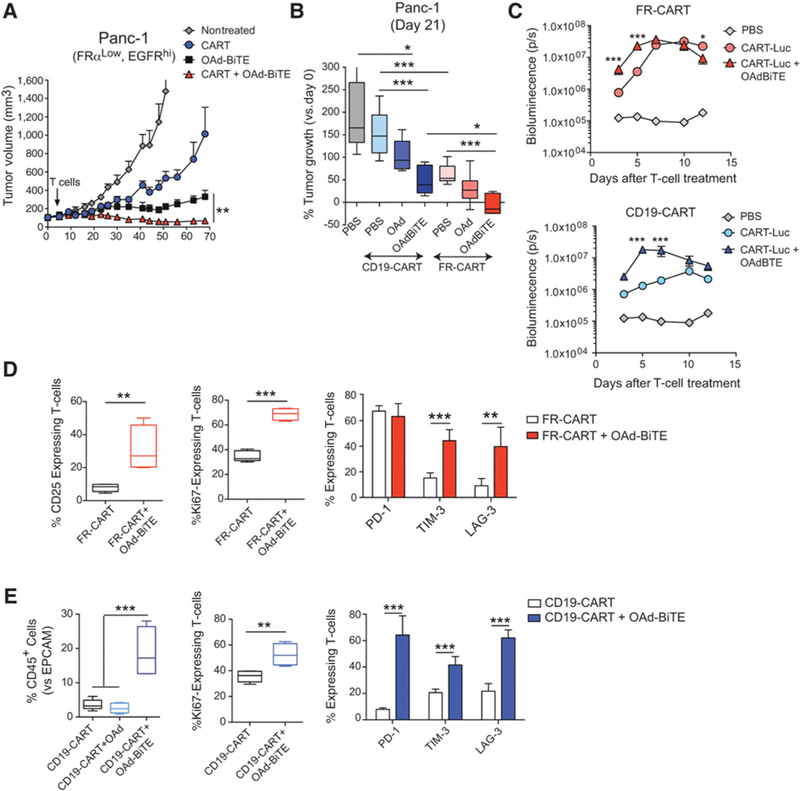
Figure 6.

Combination of OAd-BiTE and CART cells shows enhanced antitumor effects with improved T-cell activation in vivo. NSG mice bearing 30-day established Panc-1 tumors were treated with OAd-BiTE (1 × 10⁹vp) or PBS. Five days later, animals were treated with an intravenous injection of 1 × 10⁷ FR-CART cells. A, The mean tumor volume ± SEM (n = 5 per group) is plotted. *, P < 0.05 by two-way ANOVA with Tukey post hoc test. B, Percentage of Panc-1 tumor growth indicated as the change in tumor volume on day 21 versus baseline (n = 5–7 per group). *, P < 0.05; **, P < 0.01; ***, P < 0.001 by one-way ANOVA with Tukey post hoc test. C, T-cell accumulation in Panc-1 tumors as measured by bioluminescence. Mice bearing Panc-1 tumors were treated with OAd-BiTE or PBS. Three days later, animals were treated with 1 × 10⁷ FR-CART-Luc or CD19-CART-Luc cells. Five animals were used for each indicated group. *, P < 0.05; **, P < 0.01; ***, P < 0.001 by two-way ANOVA with Tukey post hoc test. D and E, Proliferation of tumor-infiltrating T-cells (as indicated by Ki67 staining) and T-cell phenotype were evaluated by flow cytometry at day 15 (D) or 12 (E) after treatment. **, P < 0.01; ***, P < 0.001 by unpaired t test (for comparison of two groups) or one-way ANOVA with Tukey post hoc test (for comparison of more than two groups).
