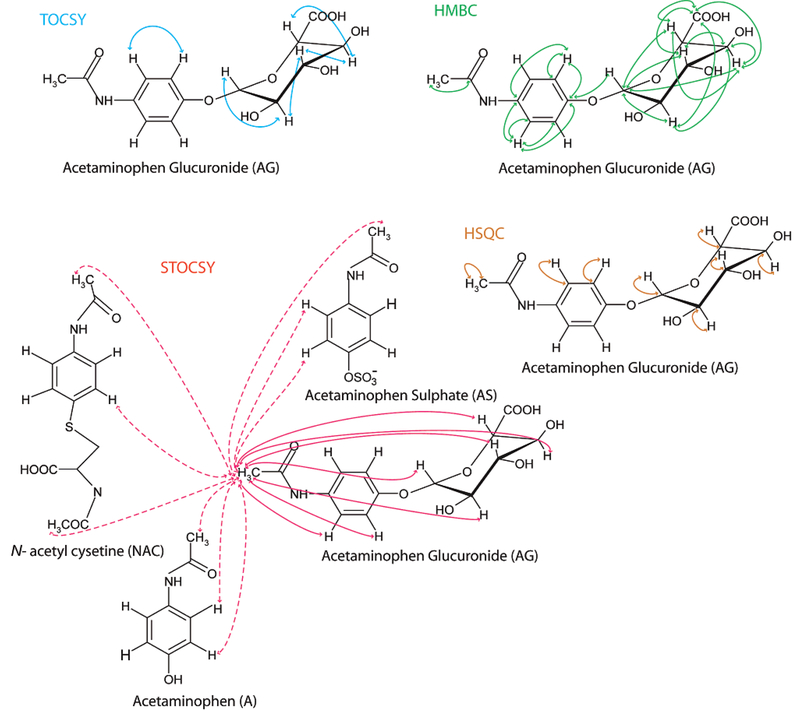
Figure 5.
Schematic for acetaminophen glucuronide comparing the intramolecular 1H-1H and 1H-13C correlations detected in the TOCSY (blue), HSQC (brown), HMBC (green), and intra-and intermolecular (dotted line) correlations given by STOCSY (red) analyses. Note that these are the actual observed, and not the theoretical correlations. Although the NMR parameters were optimized for this study by adjusting the acquisition/processing parameters, it may be possible to observe further correlation structures from each of these measurements.

