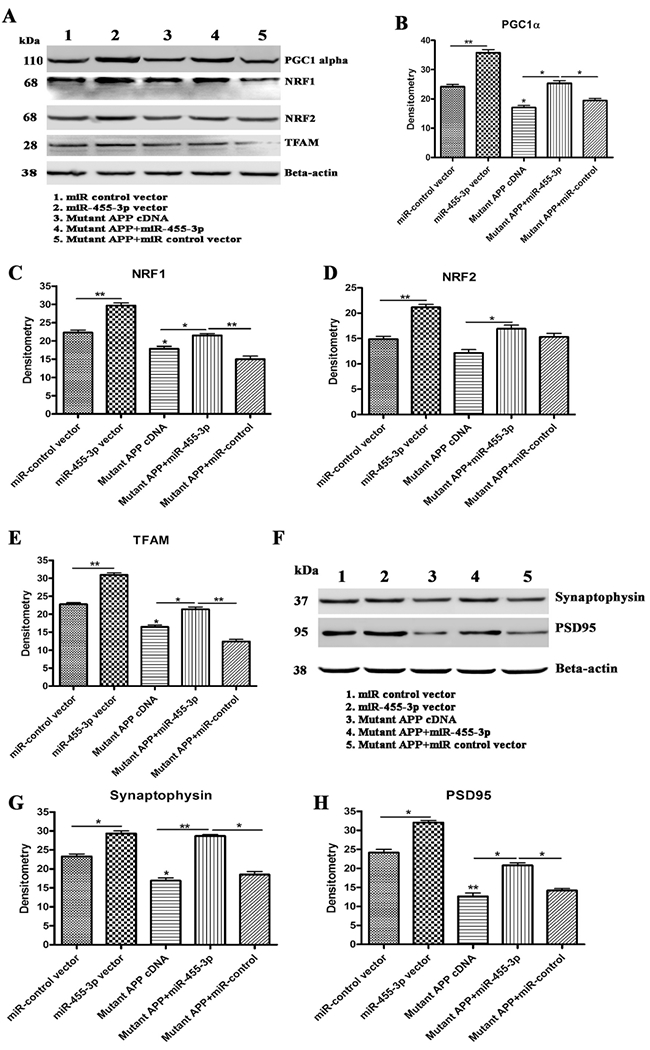
Figure 4 -. Immunoblotting for mitochondrial biogenesis and synaptic genes.

(A) Representative western blot images for PGC1α, NRF1, NRF2, TFAM, and beta-actin proteins levels in 1) Neuroblastoma cells transfected with the miR-control vector, 2) Neuroblastoma cells transfected with the miR-455-3p expression vector, 3) Neuroblastoma cells transfected with the mutant APP cDNA, 4) Neuroblastoma cells co-transfected with the miR-455-3p and mutant APP cDNA, and 5) Neuroblastoma cells co-transfected with the mutant APP and miR-control vector. Quantitative measurement of the levels of (B) the PGC1α protein (C) NRF1, (D) NRF2, and (E) TFAM using densitometry in 1) Cells transfected with the miR-control vector, 2) Cells transfected with the miR-455-3p expression vector, 3) Cells transfected with mutant APP cDNA, 4) Cells co-transfected with the miR-455-3p and mutant APP cDNA, and 5) Cells co-transfected with the mutant APP and miR-control vector. (F) Representative western blot images for synaptophysin, PSD95, and beta-actin proteins levels in 1) Cells transfected with the miR-control vector, 2) Cells transfected with the miR-455-3p expression vector, 3) Cells transfected with the mutant APP cDNA, 4) Cells co-transfected with the miR-455-3p and mutant APP cDNA, and 5) Cells co-transfected with the mutant APP and miR-control vector. Quantitative measurement of the levels of (G) the synaptophysin protein and (H) PSD95 using densitometry in same groups of cells. (*P<0.05) (**P<0.01)
