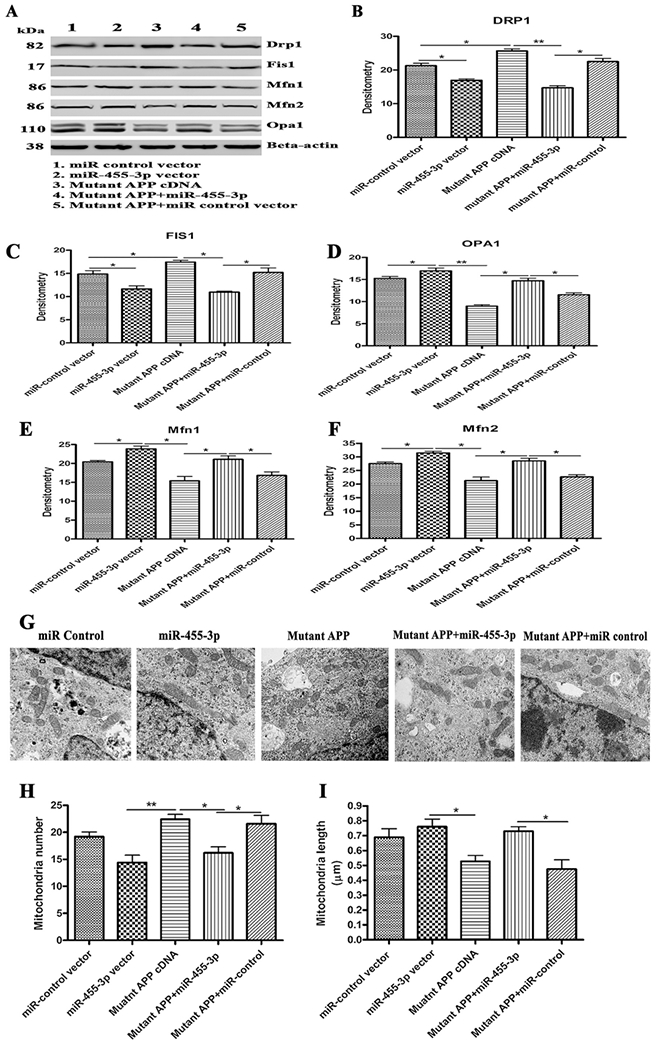
Figure 5 -. Immunoblotting for mitochondrial dynamic genes.

(A) Representative western blot images for DRP1, FIS1, OPA1, Mfn1, Mfn2 and beta-actin proteins levels in: 1) Neuroblastoma cells transfected with the miR-control vector, 2) Neuroblastoma cells transfected with the miR-455-3p expression vector, 3) Neuroblastoma cells transfected with the mutant APP cDNA, 4) Neuroblastoma cells co-transfected with the miR-455-3p and mutant APP cDNA, and 5) Neuroblastoma cells co-transfected with the mutant APP and miR-control vector. Quantitative measurement of the levels of (B) the DRP1, (C) FIS1, (D) OPA1, (E) Mfn1 and (F) Mfn2 proteins using densitometry in the same groups of cells. (G) Representative TEM images of Neuroblastoma cells transfected with the miR-control vector, the miR-455-3p vector, mutant APP cDNA, co-transfected with mutant APP and miR-455-3p, and co-transfected with mutant APP and miR-control, showing mitochondrial organization (600 nm magnification). (H) Quantification of the number of mitochondria in the Neuroblastoma cells transfected with miR-control vector, the miR-455-3p vector, mutant APP cDNA, co-transfected with mutant APP and miR-455-3p, and co-transfected with mutant APP and miR-control. (I) Quantification of the size of mitochondria (μm) in the neuroblastoma cells transfected with miR-control vector, the miR-455-3p vector, mutant APP cDNA, co-transfected with mutant APP and miR-455-3p, and co-transfected with mutant APP and miR-control. (*P<0.05) (**P<0.01).
