
Table 4.
SFSR of the LHS Moiety of Compound 1a
 | ||||||||
|---|---|---|---|---|---|---|---|---|
| Cmpd | LHS | EC50(nM) | pEC50 ± SEM | Emax ± SEM(%) | EC50(nM) | pEC50 ± SEM | Emax ± SEM(%) | Bias for cAMP accumulation |
| 1 |  |
0.25 | 9.61 ± 0.18 | 61 ±3 | 110 | 6.94 ± 0.16 | 48 ± 3 | 7.7 |
| 26 |  |
62 | 7.21 ± 0.08 | 67 ± 2 | N.A. | N.A. | N.A. | N.C. |
| 27 |  |
79 | 7.10 ± 0.05 | 69 ± 1 | N.A. | N.A. | N.A. | N.C. |
| 28 | 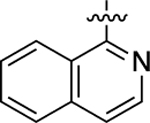 |
15 | 7.84 ± 0.06 | 82 ± 2 | >10,000 | <5.00 | N.D. | N.C. |
| 29 | 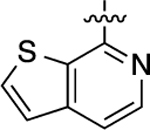 |
0.23 | 9.64 ± 0.05 | 100 ± 1 | 22 | 7.67 ± 0.10 | 63 ± 2 | 1.9 |
| 30 | 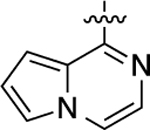 |
0.87 | 9.06 ± 0.09 | 83 ± 2 | 690 | 6.16 ± 0.19 | 59 ± 4 | 15 |
| 31 | 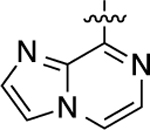 |
260 | 6.59 ± 0.03 | 85 ± 1 | N.A. | N.A. | N.A. | N.C. |
| 32 | 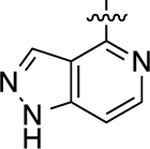 |
1.8 | 8.76 ± 0.04 | 104 ± 1 | >10,000 | <5.00 | N.D. | N.C. |
| 33 | 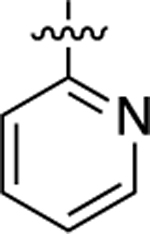 |
120 | 6.91 ± 0.06 | 83 ± 2 | >10,000 | <5.00 | N.D. | N.C. |
| 34 | 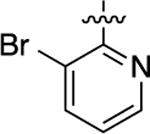 |
>10,000 | <5.00 | N.D. | N.A. | N.A. | N.A. | N.C. |
| 35 | 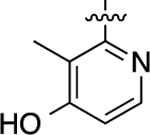 |
160 | 6.79 ± 0.11 | 34 ±1 | N.A. | N.A. | N.A. | N.C. |
| 36 | 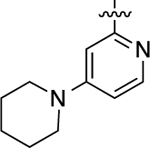 |
640 | 6.19 ± 0.07 | 26 ± 1 | N.A. | N.A. | N.A. | N.C. |
a
EC50 and EMAX values are the mean of at least three independent experiments performed in triplicate with standard error of the mean (SEM) values. N.A. no activity at maximum concentration tested (10−4 M), N.D. not determined, N.C. not calculable.