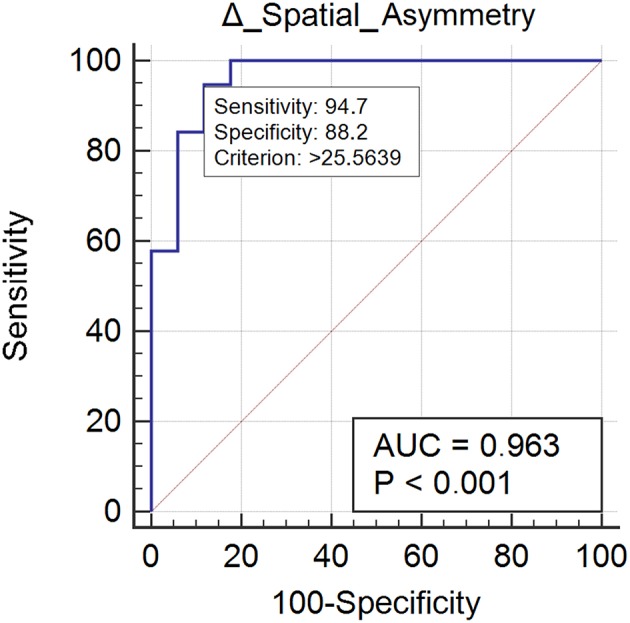
Figure 2.

This figure illustrates the Area Under the Receiver Operating Characteristics curve (AUC) of spatial asymmetry improvements. The diagonal purple line represents the non–significance threshold of AUC = 0.50, the blue line represents the true positive rate and the false positive rate at each threshold. Sensitivity and specificity for the optimal MCID (criterion) are reported.
