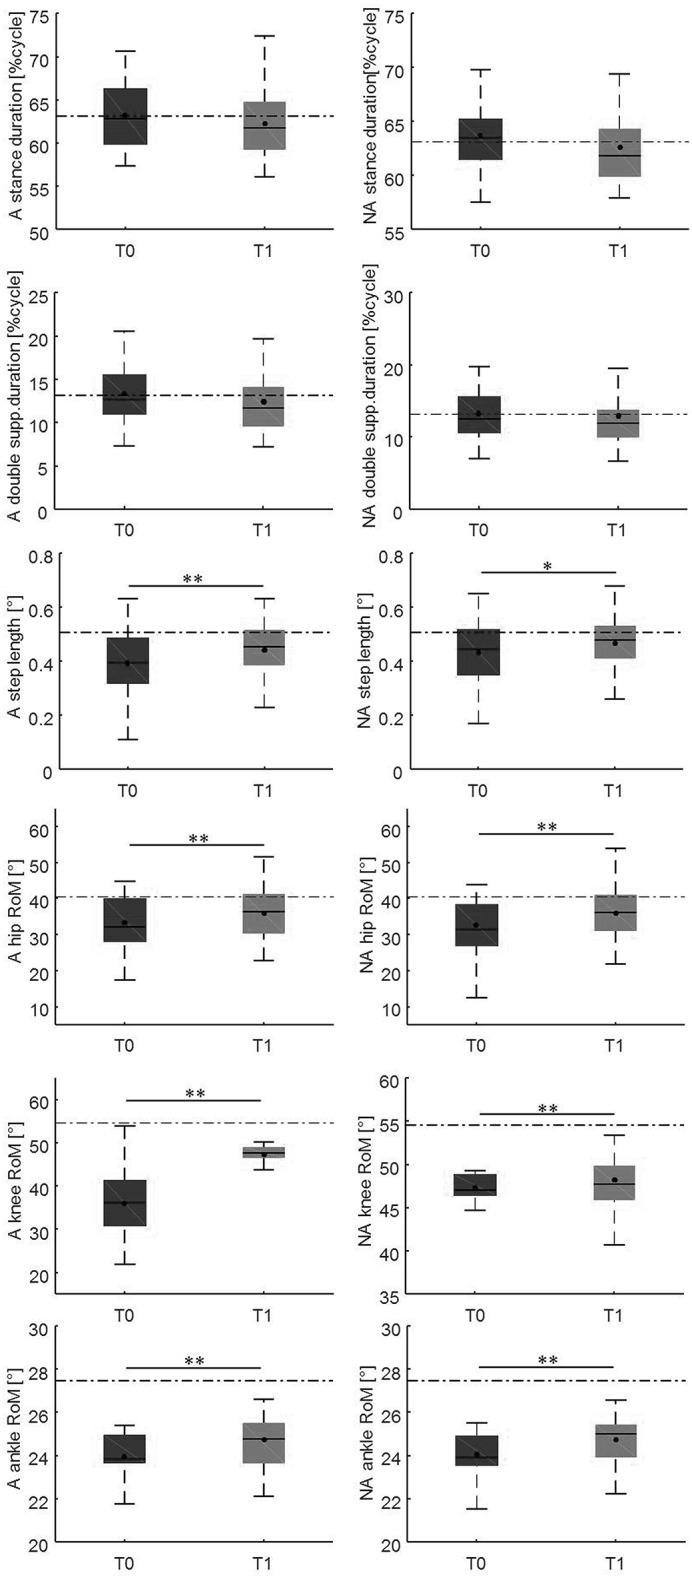
Figure 5.

This figure illustrates the side-dependent time-distance parameters and hip, knee, and ankle joint kinematics at baseline and at the 10-weeks follow-up. For each box, the central black horizontal line indicates the median, the central black dot denotes the mean, and the bottom and top edges of the box indicate the 25 and 75th percentiles, respectively. Whiskers extend to the most extreme data points not considered outliers. Asterisks denote statistically significant differences (*p < 0.05; **p < 0.01). Black horizontal dashed lines represent the mean of each parameter in the healthy control group. A, most affected/affected side; flex-ext, flexion-extension; NA, less affected/unaffected side; RoM, Range of Motion; T0, baseline; T1, 10-weeks follow-up.
