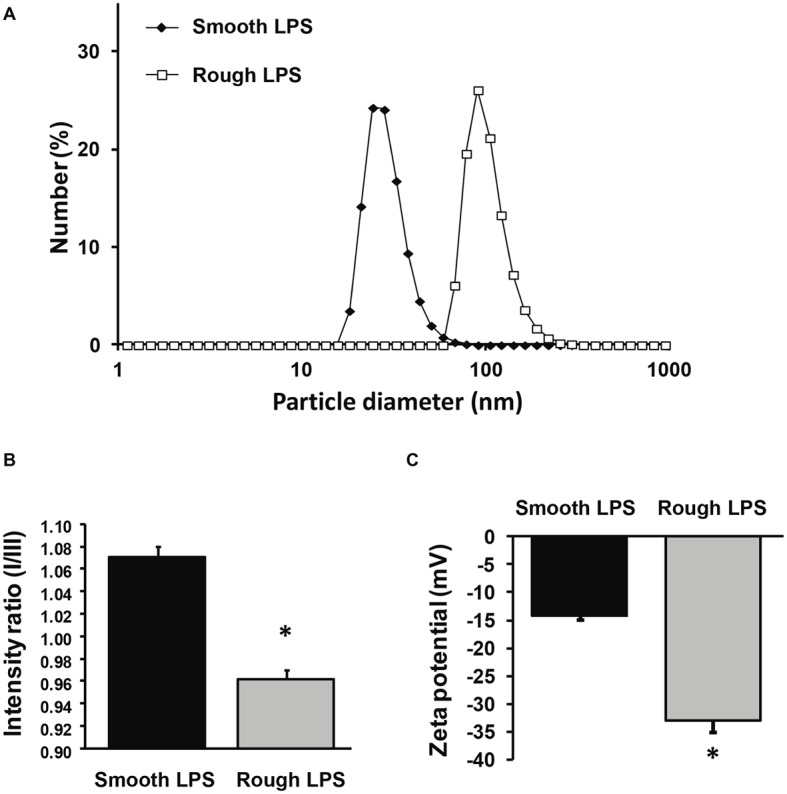
Figure 7.

Size distribution, zeta potential, and hydrophobicity index of structures formed by smooth and rough LPS. Size distribution of smooth LPS (closed diamonds) and rough LPS (open squares) in saline was determined by dynamic light scattering (A). Hydrophobicity index (B) and zeta potential (C) of smooth (black bars) and rough LPS (gray bars) was determined by spectrofluorimetry using a pyrene probe and by zetametry, respectively. See “Experimental Procedures” for additional experimental details. Bars are mean ± SE of quadruplicate measurements. *Significantly different from smooth LPS, p < 0.05. All panels are representative of three distinct experiments.
