Figure 4.
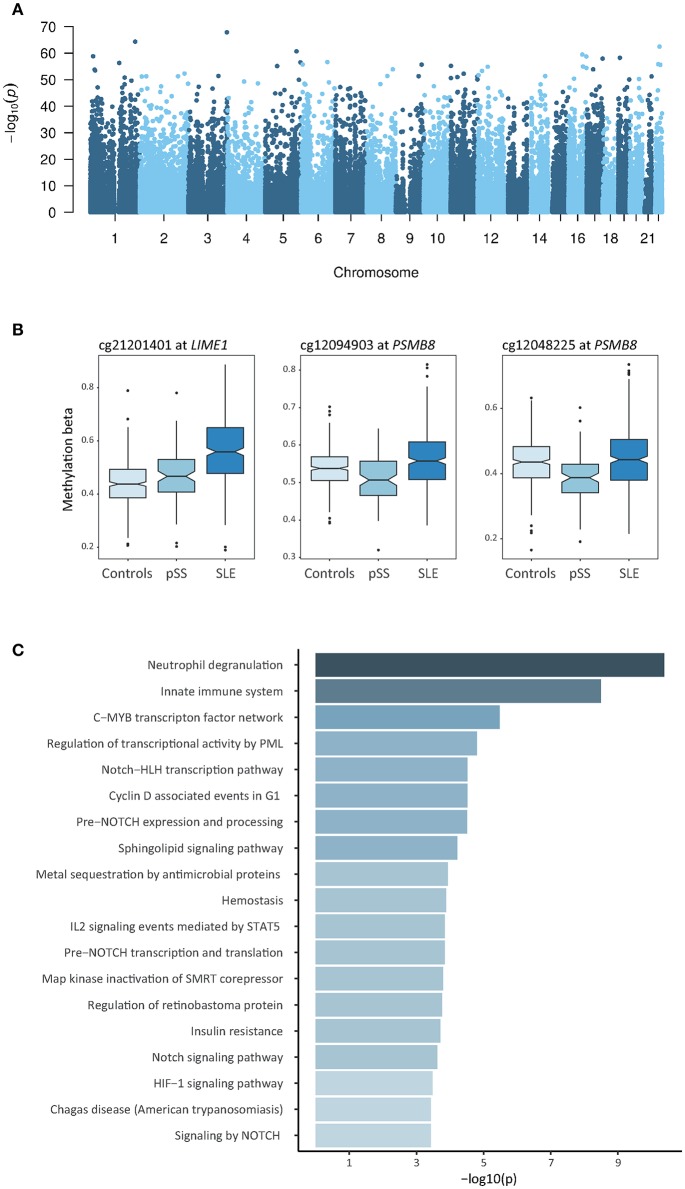
Results of the cross-comparative analysis of differential DNA methylation between SLE and pSS. (A) Manhattan plot showing the results of the analysis comparing DNA methylation in patients with SLE to patients with pSS. Presented are the –log10 transformed p-values of the association between the tested CpG sites and the disease status against the chromosomal position of the investigated sites. (B) Box plots of DNA methylation levels at DMCs identified in the analysis between patients with SLE compared to patients with pSS at LIME1 and at two neighboring CpG sites within the PSMB8-TAP2 locus. (C) Functional pathway analysis. The bar plot depicts the results of the functional pathway analysis of the 1,000 most significantly associated DMC in the SLE-pSS case-case analysis that have a unique gene name annotation. Significantly enriched pathways are presented on the y-axis with their corresponding –log10(p) on the x-axis.

