
Figure 5.
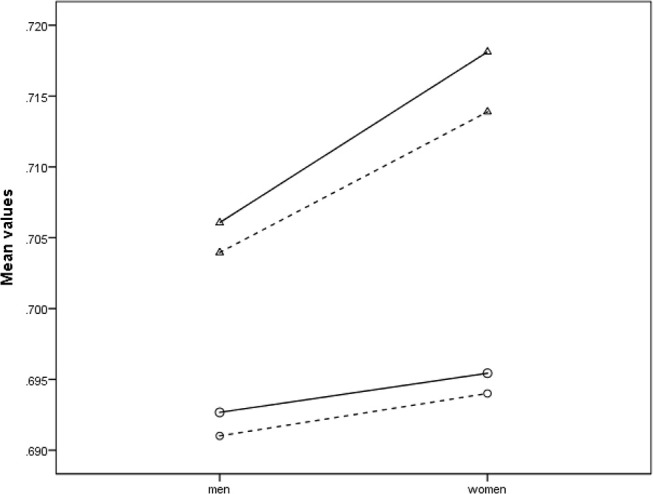
Line graph showing sex differences in palmar-to-dorsal digit ratios of digit 2 (Δ) and digit 4 (O), measured through the HT (__) and the HA (−−−) procedures. (i) Men have lower palmar-to-dorsal digit ratios than women, and this effect is stronger for digit 2 than for digit 4. (ii) The pattern of sex differences observed in digits 2 and 4 is similar for both (HT or HA) procedures. (iii) Digit ratios derived from the HT procedure are higher than those derived from the HA procedure, and, among both men and women, this effect is stronger for digit 2 than for digit 4.