FIGURE 4.

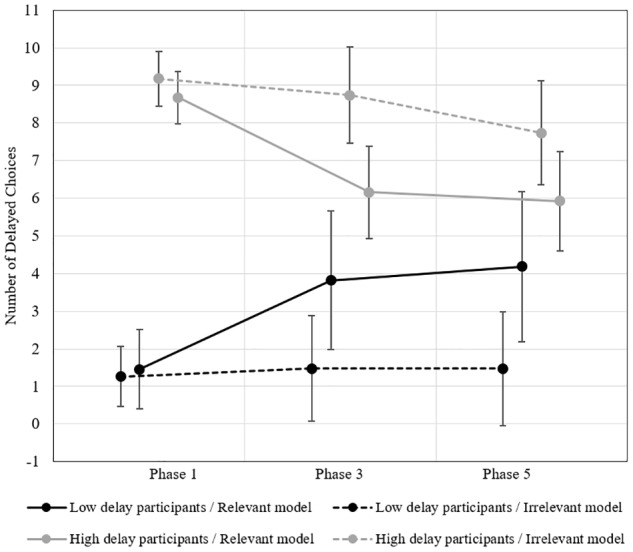
Study 4. Mean number of delayed choices before and after exposure to the high delay vs. low delay models (N = 78). Error bars represent 95% CIs.

Study 4. Mean number of delayed choices before and after exposure to the high delay vs. low delay models (N = 78). Error bars represent 95% CIs.