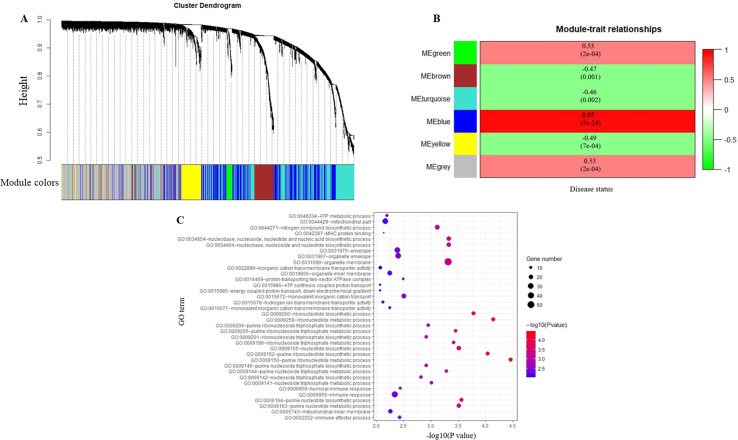
Figure 3.
Identification of modules associated with major depressive disorder (MDD) and Gene Ontology analysis. (A) Dendrogram of all differentially expressed genes clustered based on a dissimilarity measure (1-TOM). (B) Heatmap of the correlation between module eigengenes and the disease status (MDD vs. control). Each cell contains the corresponding correlation and p-value. (C) Gene Ontology analysis of genes in the blue module.

