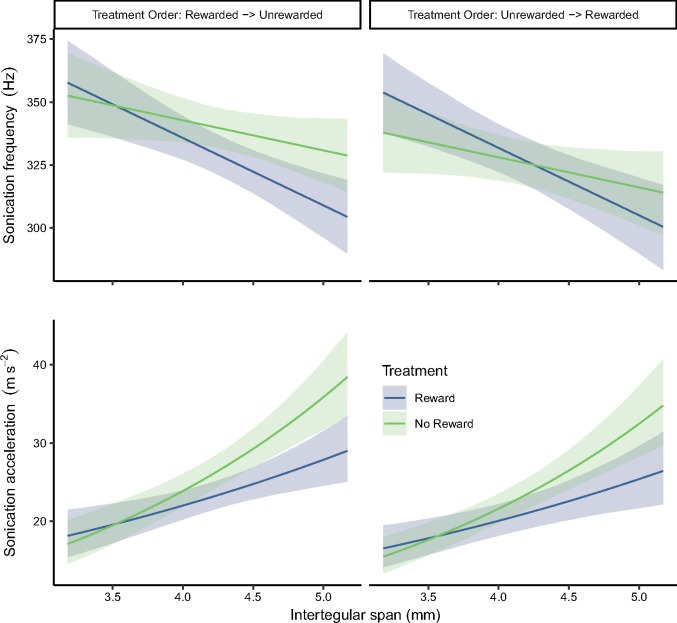
Figure 2.
Estimated sonication frequency (Top) and acceleration (Bottom) for bees that were rewarded versus unrewarded with pollen. Data are shown for frequency (top row) and acceleration (bottom row) and by treatment order and treatment order (columns). We found that both the receipt versus absence of a pollen reward and bee size (IT span) affected sonication frequency and acceleration. Treatment order affected sonication frequency but did not have a strong effect on acceleration. In this figure, we show estimates for only 1 colony (colony 4), but the plots for both colonies can be found in Supplementary Figure S8 and Supplementary Figure S9. Plotted lines indicate estimated means and shaded regions indicate 95% bootstrap confidence intervals. The curve of the acceleration line is due to the log-transformation for data used in statistical models.

