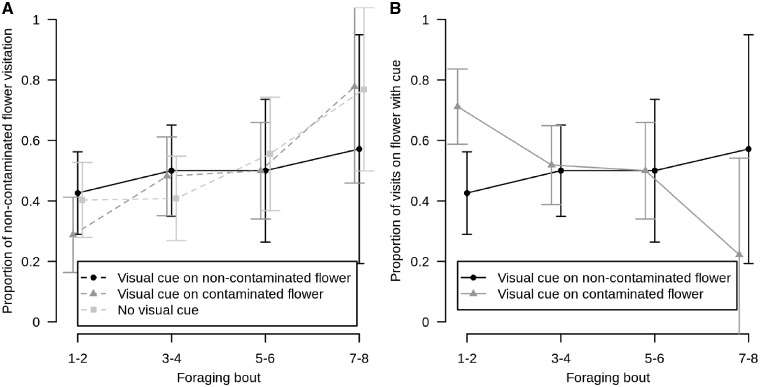
Figure 4.
Proportion of visits by bumblebees on the non-contaminated flower and on the flower with social visual cue among treatments during the learning period (the first 3 days). (A) Proportion of non-contaminated flower visitation during the learning period (Days 1–3) among the 3 treatments. (B) Proportion of visits by bumblebees on flowers with social visual cue in relation to the contamination status of the flower where the social visual cue is present. Only the learning period is represented (Days 1–3), since only during this period conspecifics were present on flowers. The points represent the means between the different bumblebees and treatment and bars represent their 95% confidence interval.

