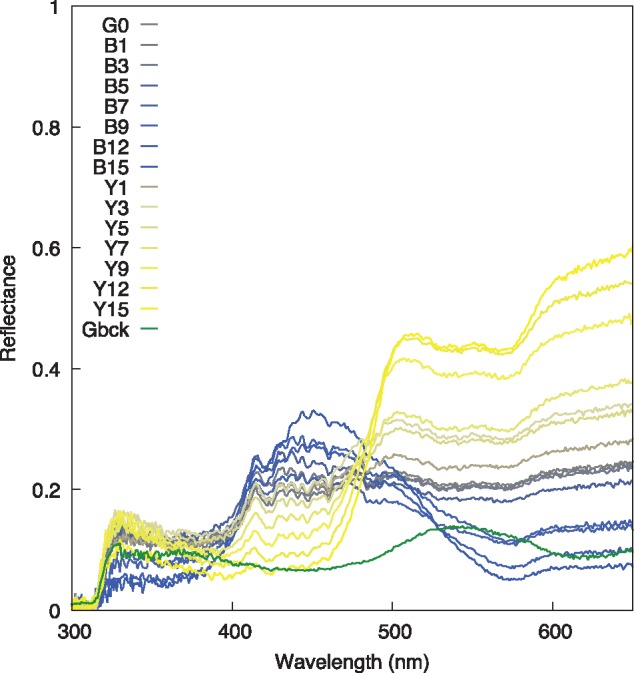
Figure 1.

Spectral reflectance curves of the 15 color stimuli specified in Table 1. Long wavelength rich stimuli are of “yellow” appearance with Y15 having the peak reflectance above 600 nm, and progress through to the “blue” stimuli with B15 having the lowest reflectance above 600 nm. The background green color spectrum is also shown (Gbck).
