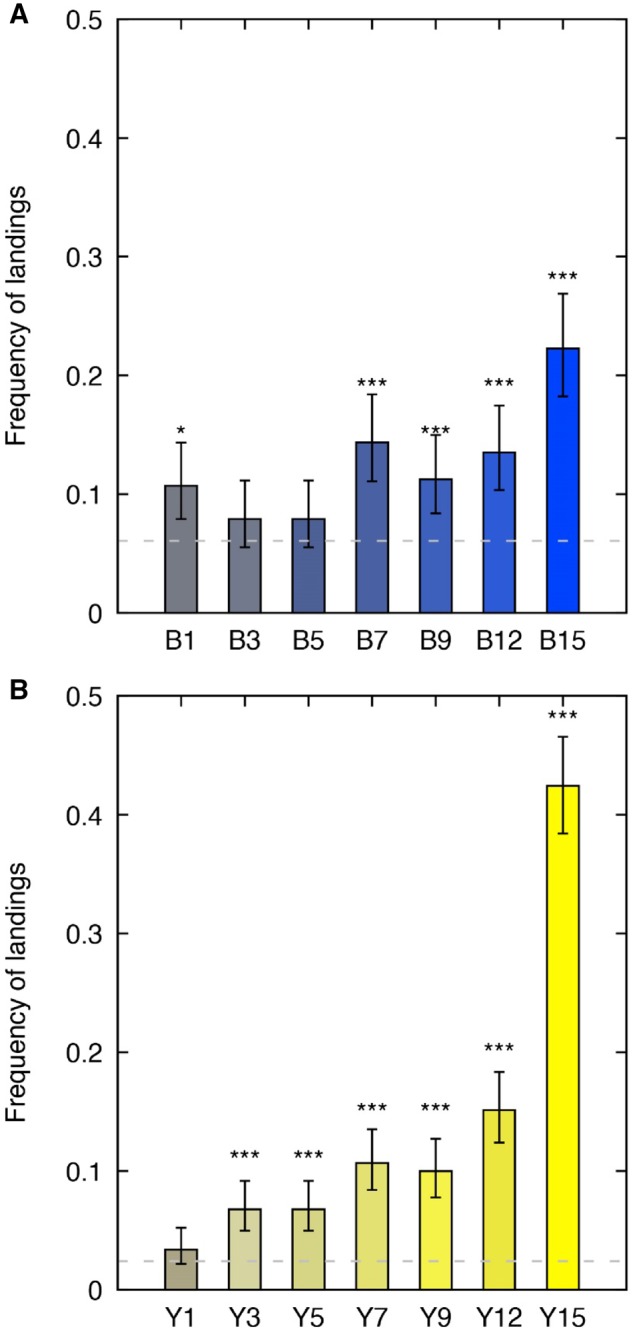
Figure 5.

Mean frequency of landings observed for each of the (A) “blue” colour stimuli; and (B) the “yellow” color stimuli. The x-axis shows the name of each stimulus as per Table 1. Stimuli were sorted in an increasing order of distance from G0 (ΔC in Table 1). Gray shaded line indicates the respective frequency of landings for G* used as baseline for the statistical analyses. (*) indicates P-values=0.05 and (***) indicates P-values<0.001 as reported in Table 2.
