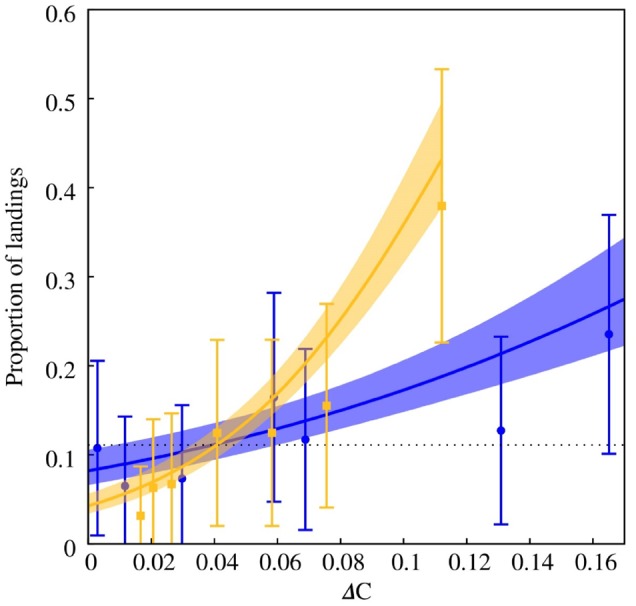
Figure 6.

Generalized linear mixed model describing the effect of color dissimilarity on the proportion of landings for various “blue” (filled circles) and “yellow” stimuli (filled squares) by the hoverfly E. tenax. Solid lines represent the best fit model to the respective data set and shaded areas the 95% credibility intervals for each model. Markers indicate the mean proportion of landings observed for each colored stimulus during the experiment and error bars represent the standard error of the mean. Mean posterior distribution for the coefficients defining the fixed terms of the 2 functions is given in Table 3. The posterior distributions of the terms describing the random effect of the 10 different fly cohorts on the color discrimination model for the “yellow” and “blue” stimuli are provided as Supplementary Material S-1. Histograms for the random terms for each cohort suggest that there is not a major difference in variability between cohorts for either the blue or yellow stimuli.
