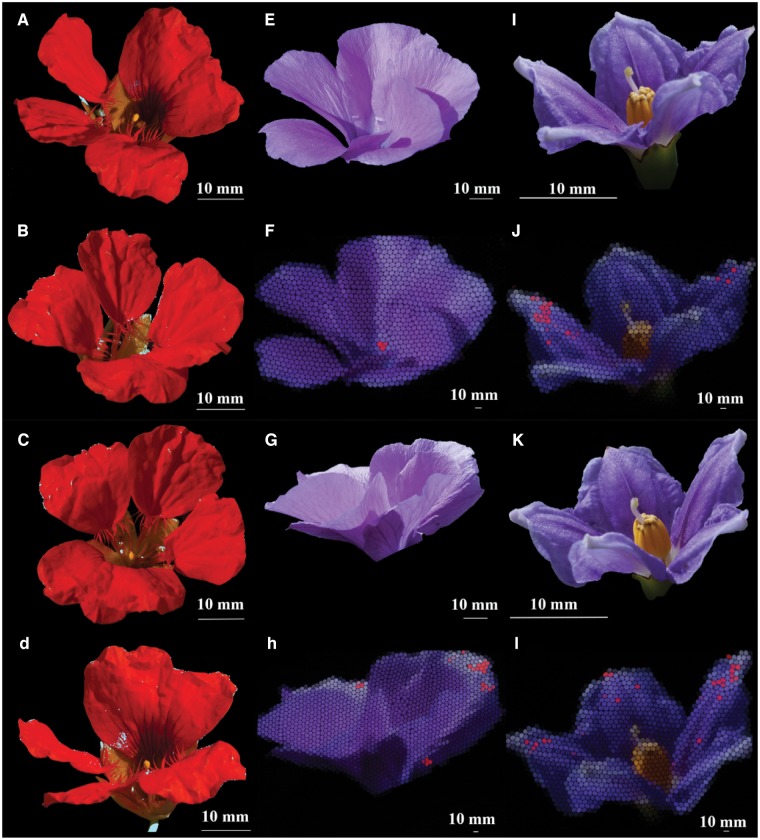
Figure 5.
Composite images indicating regions of perceivable structural color in T. majus (first column, panels A–D) A. huegelii (second column, panels E–H), and S. laciniatum (third column, panels I–L). Areas of structural coloration potentially perceivable to a honeybee are indicated with cyan color if not present on the petal area or red color otherwise. Panels E, G, I, and K depict RGB representations of A. huegelii (panels E and G) and S. laciniatum (panels I and K) at 1:5 and 1:3 magnification ratios. Panels F, H, J, and I correspond to the same RGB images after being projected by a mechano-optical device: A. huegelii (panels F and H) and S. laciniatum (panels J and L). In panels F, H, I, and J, the red color indicates potentially perceivable structural color regions when considering both spectral and spatial threshold values set by the properties of the honeybee’s visual system. Scale bars on panels A–E, G, I, and K represent the flower’s size; on panels F, H, J, and L, scale represent the size of the projected image. T. majus images represent viewing angles: ϴ = 0°, ϕ = 75° (panel A); ϴ = 90°, ϕ = 30° (panel B); ϴ = 135°, ϕ = 60° (panel C); and ϴ = 315°, ϕ = 60° (panel D). Images corresponding to: A. huegelii (second column) and S. laciniatum (third column) represent viewing points at which the percentage of structural to visible color area (RAD) were maximal for each species: (E, F) ϴ = 90°, ϕ = 30°; (G, H) ϴ = 225°, ϕ = 15°; (I, G) ϴ = 180°, ϕ = 15°; and (K, L) ϴ = 270°, ϕ = 30°.

