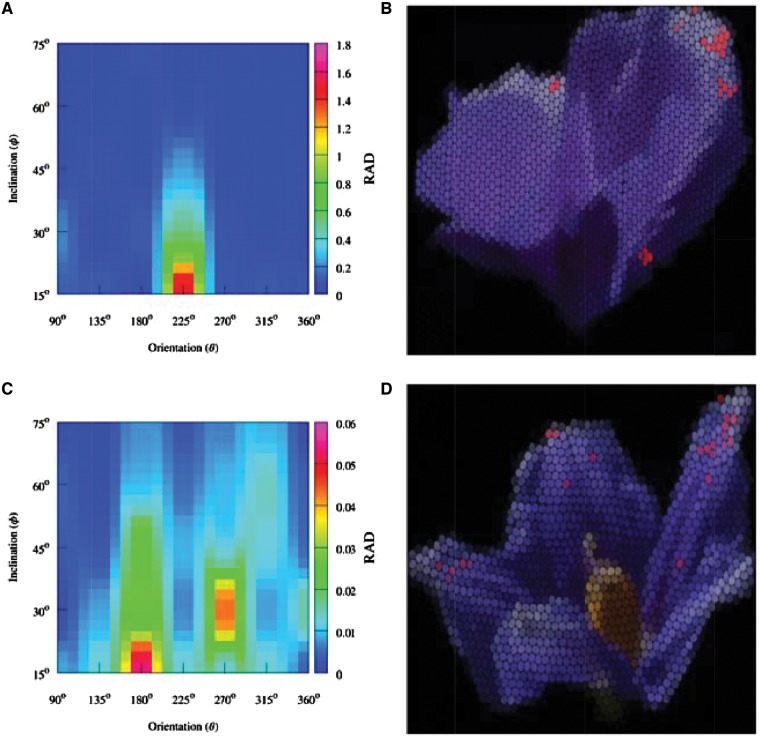
Figure 8.
Color map representing the ratio of angle dependent color areas [indicated as red dots on panels (B) and (D)] to total visible area (RAD) as a function of orientation (x-axis) and inclination (y-axis) for A. huegelli [panel (A)] and S. laciniatum [panel (C)]. Panels (B) and (D) show and RGB representation of A. huegelli and S. laciniatum, respectively, as produced by the mechano-optical device used to simulate the image produced by the honeybee compound eye (Knowles and Dartnall 1977; Williams and Dyer 2007), at the orientation and inclination position showing the largest area of angle dependent coloration for each species. On panels (B) and (D) image regions where angle dependent coloration is discriminable from the pigment background 95 % of the time are indicated by a red color to aid visual interpretation by human observers.

