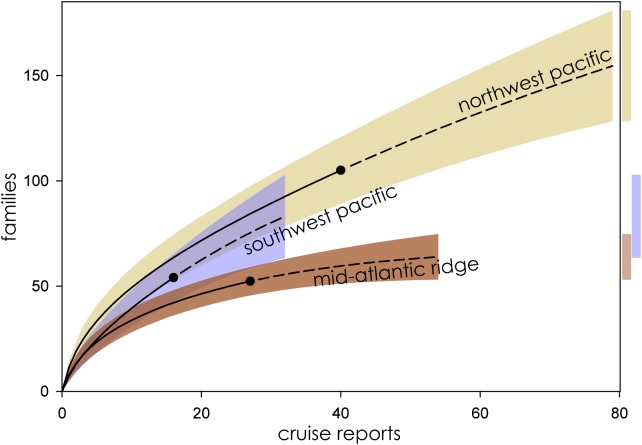
Figure 3. Family richness in the Northwest Pacific, Southwest Pacific, and Mid-Atlantic Ridge.
Parametric interpolation (solid line terminating in black dot) and non-parametric asymptotic extrapolation (dashed line) with 95% confidence intervals (colored bounding areas). Color-coded guide bars on far right correspond to 95% confident intervals at twice the reference sample.

