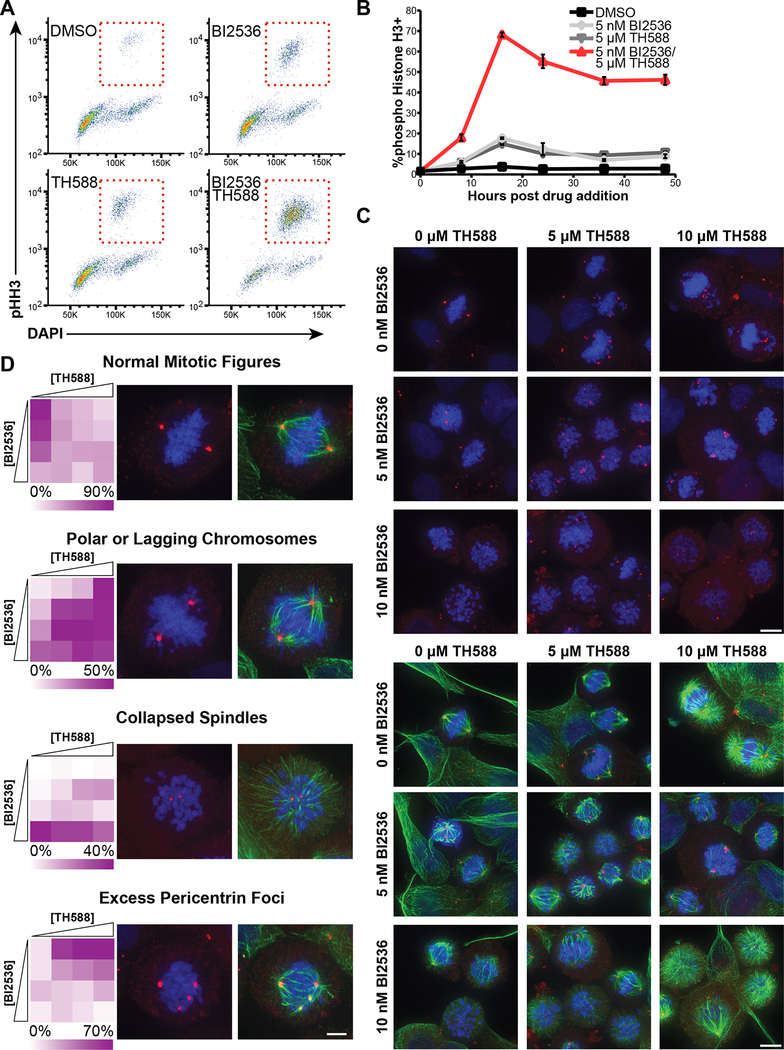
Figure 5. Plk1 inhibition and TH588 synergistically arrest cells in mitosis, disrupt spindle formation and prevent metaphase chromosome alignment.
(A) C4–2 CRPC cells were treated for 16 hours with 5 nM BI2536, 5 μM TH588, or both in combination, and mitotic arrest measured by flow cytometry using DAPI and pHH3 antibody staining. Red boxes indicate the mitotic population.
(B) Time course of pHH3+ cell accumulation caused by either BI2536 or TH588 alone, or their combination. C4–2 cells were fixed at the indicated time and stained as above. Mean ± SEM (n = 3).
(C) C4–2 cells were treated with a dose-response matrix of BI2536 and TH588 for 16 hours and defects in the assembly of the mitotic spindle were assessed by deconvolution microscopy. Pericentrin (red) and tubulin (green) were detected by immunofluorescence; DNA was stained with DAPI (blue). Shown are representative projections of deconvoluted Z-stacks from a subset of the dose-response matrix. (A 2.5 nM BI2536 column and 2.5 μM TH588 row are omitted for brevity, shown in Figure S4A). White arrows indicate the appearance of multipolar spindles and polar chromosomes. Scale bars at bottom right of each matrix indicate 10 μm. Top and bottom panels show identical fields of cells, with DAPI and pericentrin staining shown in top panels and DAPI, pericentrin, and tubulin staining shown in bottom panels.
(D) Mitotic spindle defects caused by each dose combination in the matrix described above were categorized based on phenotype. ‘Normal mitotic figures’ includes prophase, prometaphase, metaphase, anaphase and telophase cells. Mitotic cells with ‘polar or lagging chromosomes’ contained chromosomes that either overlapped the plane of a centrosome, or were positioned between the centrosome and the cell cortex. ‘Collapsed spindles’ were characterized by centrosomes surrounded by a cloud of chromosomes and tubulin polymers radiating from the center of the cell. The above three groups are mutually exclusive, but may co-occur with ‘excess pericentrin foci’. Between 61 and 134 mitotic cells were categorized per condition and their frequencies are depicted in heat maps (left). Representative micrographs for each of these categories are shown (right). Scale bar in the bottom right image represents 5 μm.

