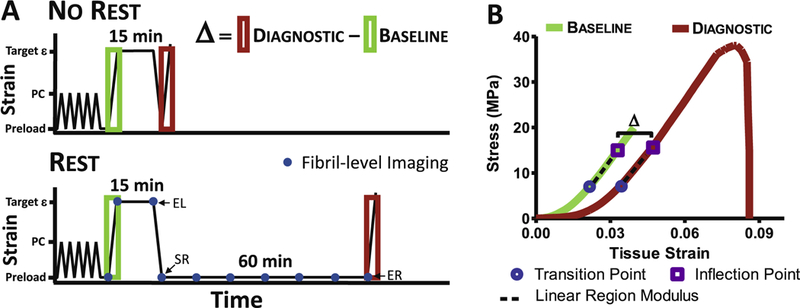
Fig. 1.

Mechanical loading profile schematic. (A) Definition of Δ = Diagnostic − Baseline was used to quantify damage when loaded to target ε (i.e., strain levels 2,4,6 or 8%) after preconditioning (PC). For No Rest group, fascicle was loaded to failure immediately after unloading, whereas Rest group was allowed to rest for 60 min at the reference length before loading to failure. The blue dots represent when confocal images were taken for quantifying fibril-level deformation. EL (end of loading), SR (start of rest), and ER (end of rest) marked on the figure are used for calculating fibril-level recovery. (B) Representative stress-strain curve with fascicle-level parameters. All the loading and unloading rates were 1%/s. (For interpretation of the references to colour in this figure legend, the reader is referred to the web version of this article.)
