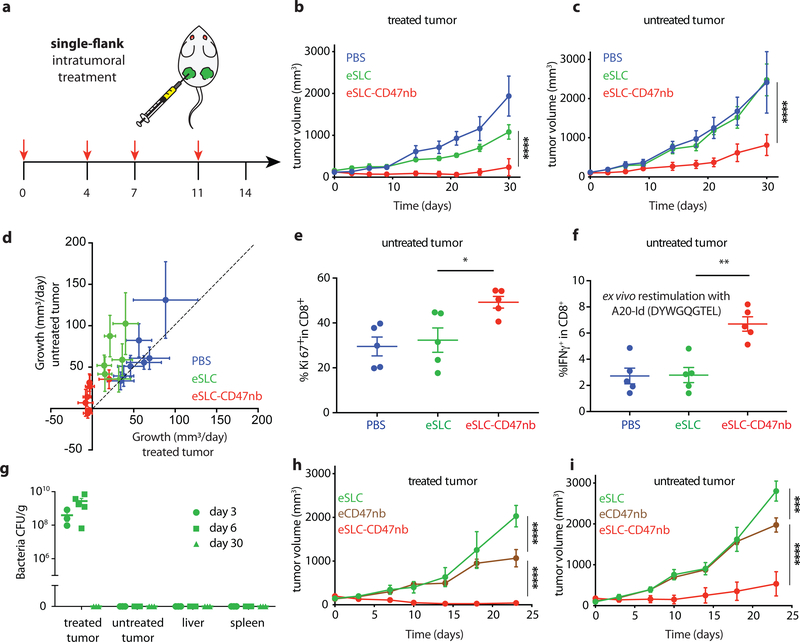
Figure 4 |. Systemic adaptive immunity following bacterial therapy limits growth of untreated tumors.
a, Treatment schedule. BALB/c mice (n=4 per group) were implanted subcutaneously with 5 × 10⁶ A20 cells on both hind flanks. When tumor volumes reached 100–150 mm3, mice received intratumoral injections every 3–4 days with PBS, eSLC or eSLC-CD47 into a single tumor. b, c Tumor growth curves of treated and untreated tumors (**** P<0.0001, two-way ANOVA with Tukey’s multiple comparisons test, error bars represent s.e.m.). Data are representative of three independent experimental replicates d, Plot of untreated tumor growth rate (mm3/day) vs. treated tumor growth rate (mm3/day) for each mouse. Dotted line indicates slope=1, points represent means, error bars represent s.e.m. e, Untreated tumors were isolated on day 8 following single flank bacterial injections and analyzed by flow cytometry. Frequencies of intratumoral Ki-67+ CD8+ T cells (n=5 per group, * P<0.05, unpaired t-test, error bars represent s.e.m.). Data are representative of two independent experimental replicates. f, Tumor infiltrating lymphocytes were stimulated following ex vivo isolation with A20-Id peptide (DYWGQGTEL) in the presence of brefeldin A. Frequencies of intratumoral IFNγ+ CD8+ T cells (n=5 per group, ** P<0.01, unpaired t-test, error bars represent s.e.m.) g, Biodistribution of SLC+ E. coli on day 3, 6 and 30 following intratumoral bacterial injection. Excised tumors, livers and spleens were homogenized and plated on LB agar plates. Colonies were counted to determine CFU/g of tissue. Limit of detection 103 CFU/g (n=3–5 per time point). h, i Tumor growth curves of treated and untreated A20 tumors following unilateral intratumoral injections of eSLC, eCD47nb or eSLC-CD47nb every 3–4 days for a total of 4 doses (n=4 per group, *** P<0.001, **** P<0.0001, two-way ANOVA with Tukey’s multiple comparisons test, error bars represent s.e.m.).

