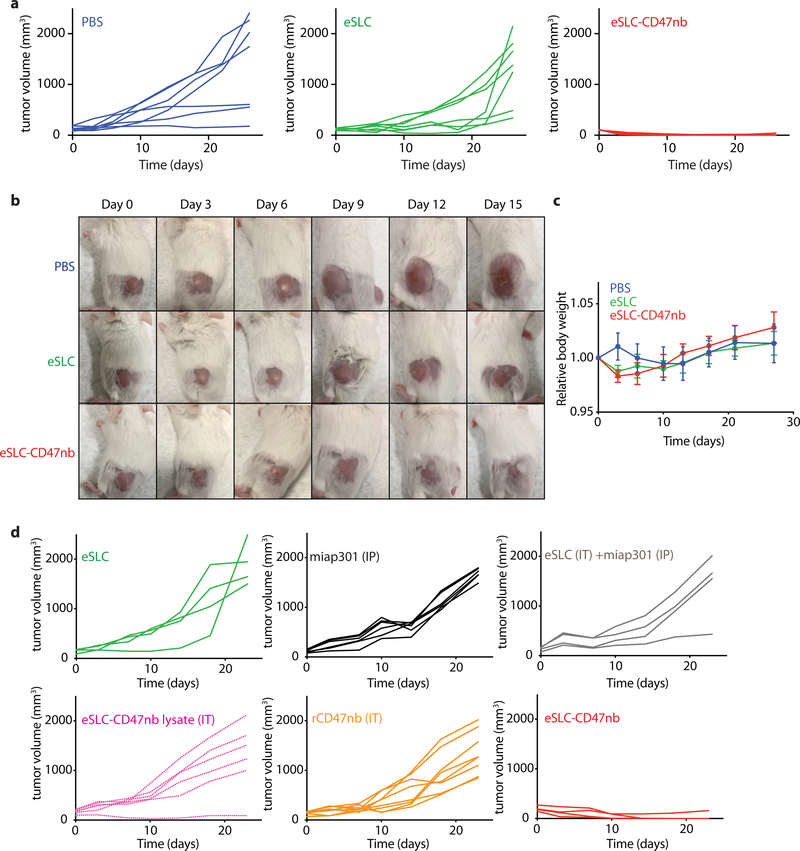
Extended Data Figure 3 |. Individual kinetics of intratumoral bacterial immunotherapy.
a, Individual tumor growth trajectories (n=7 per group). b, Representative images of subcutaneous A20 tumor bearing BALB/c mice treated with PBS, eSLC, or eSLC-CD47nb. c, Relative body weight of A20 tumor bearing BALB/c mice over time (ns (not significant), two-way ANOVA with Tukey’s multiple comparisons test). d, Individual tumor growth trajectories (n=4–8 per group) following treatment with eSLC (IT), miap301 (IP), eSLC (IT) + miap301 (IP), eSLC-CD47nb lysate, rCD47nb (IT) or eSLC-CD47nb (IT).

