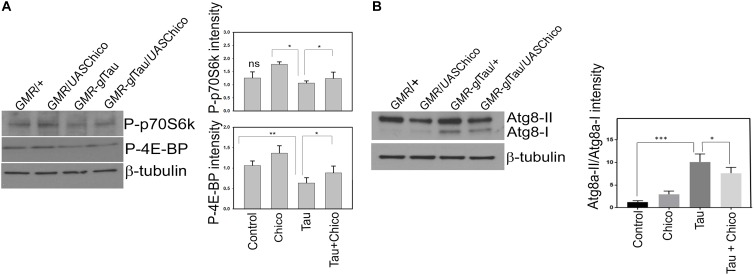
FIGURE 4.
Tau overexpression effects a reduction in the level TOR pathway markers but an increase in autophagy pathway markers (Atg8a-II/Atg8a-I) that are rescued by Chico coexpression with Tau. (A,B) Western blot analysis from flies probed with P-p70S6K, P-4E-BP1, and Atg8 antibodies. β-tubulin is the loading control. Quantification of the levels of the antibodies normalized to β-tubulin levels. (One way ANOVA with Tukey-Kramer HSD was done for multiple group comparisons or post hoc Dunnett’s test was done for comparison with Tau, n = 3 sets of biological replicates for each genotype.) Data represents the mean ± SEM, ∗∗∗P < 0.001, ∗∗P < 0.01, and ∗P < 0.05 relative to Tau. All flies were 3 days after eclosion. Genotypes: GMR-GAL4/+; GMR-GAL4/UASChico; GMR-GAL4-gl-Tau/+; and GMR-GAL4-gl-Tau/UASChico.

