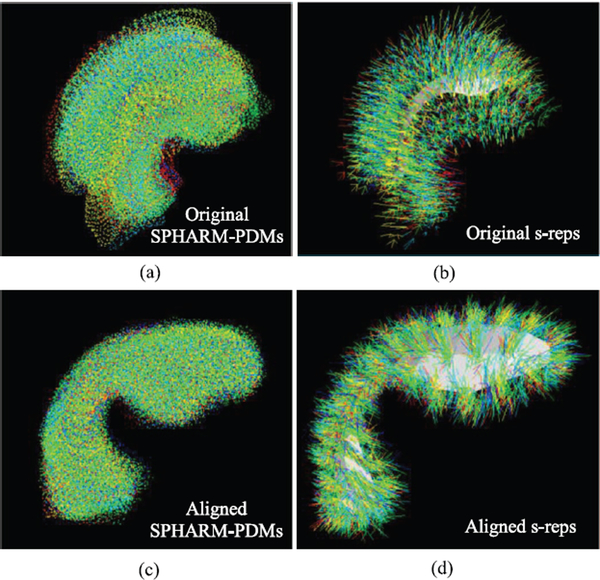
Fig. 4.
All the 94 training shapes overlaid on top of each other. Each shape is described by the SPHARM-PDM (a) and the s-rep (b). After applying the Procrustes alignment, the shapes described by both shape models get close and tight as (c) and (d). Colors indicate different shapes in the population.

