
FIG. 56.
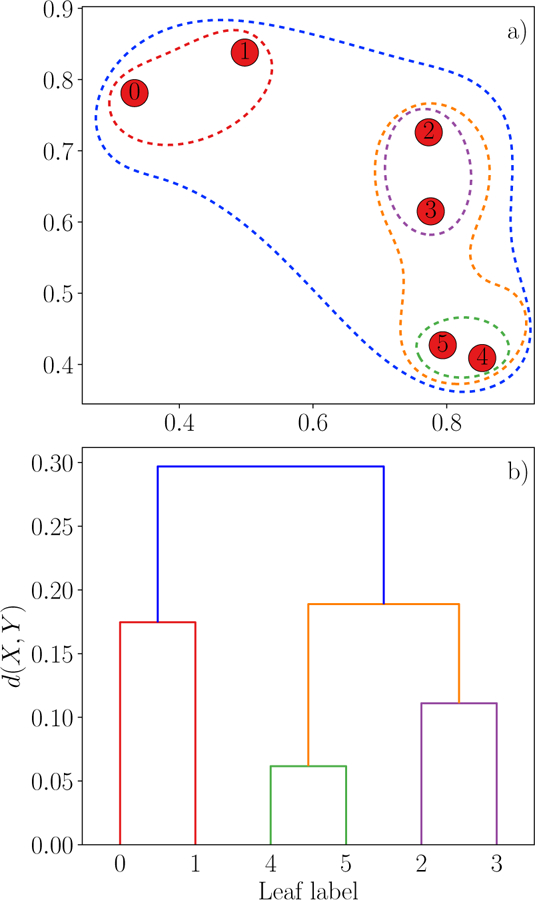
Hierarchical clustering example with single linkage. (a) The data points are successively grouped as denoted by the colored dotted lines. (b) Dendrogram representation of the hierarchical decomposition. Each node of the tree represents a cluster. One has to specify a scale cut-off for the distance measure d(X, Y ) (corresponding to a horizontal cut in the dendrogram) in order to obtain a set of clusters.