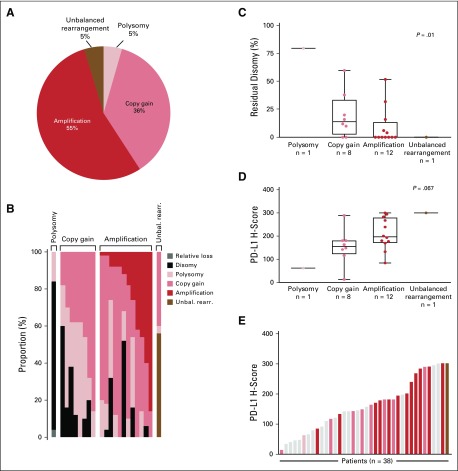
FIG 3.
Chromosome 9p24.1 alterations and programmed death-ligand 1 (PD-L1) expression (H-scores) in evaluated patients with classic Hodgkin lymphoma (cHL) from Cohort D. (A) Prevalence of 9p24.1 genetic alterations in 22 evaluable patients with cHL. (B) The spectrum of 9p24.1 alterations in evaluated cHLs. Each patient is classified by the highest observed level of 9p24.1 alteration in Hodgkin Reed-Sternberg (HRS) cells: polysomy, copy gain, amplification, or unbalanced rearrangement. Individual patients are represented by columns on the x axis, and the percentage of HRS cells with relative loss (dark gray), disomy (black), polysomy (light pink), copy gain (medium pink), amplification (red), or unbalanced rearrangement (brown) is depicted on the y axis. In patients classified by the highest observed level of 9p24.1 alteration, additional HRS cells had lower-level 9p24.1 copy number alterations, as previously described.7,8 For example, patients classified as having 9p24.1 amplification had additional HRS cells with 9p24.1copy gain, 9p24.1 polysomy, and/or 9p24.1 disomy. cHLs identified as having 9p24.1 copy gain included additional HRS cells with 9p24.1 polysomy and/or 9p24.1 disomy; patients classified as polysomic for chromosome 9p24.1 had additional HRS cells that were disomic for 9p24.1, as previously described.7,8 (C) Percentage of disomic HRS cells in cHLs classified by 9p24.1 alterations. The percentage of 9p24.1 disomic HRS cells was highest in tumors classified as polysomic for 9p24.1, intermediate in tumors with 9p24.1 copy gain, and lowest in tumors with 9p24.1 amplification, as previously described.7,8 P value calculated using the Kruskal-Wallis rank-sum test. (D) PD-L1 H-scores in cHLs classified by 9p24.1 alterations (22 evaluable patients). PD-L1 H-scores are calculated by multiplying the percentage of PD-L1-positive HRS cells (Pax5dim+; 0% to 100%) and the average intensity of PD-L1 staining (0 to 3+) in evaluated HRS cells. P value calculated using the Kruskal-Wallis rank-sum test. (E) PD-L1 H-scores in all evaluable patients with cHL (n = 38; 18 patients were evaluable for PD-L1 immunohistochemistry but not fluorescence in situ hybridization). Individual samples are visualized as columns on the x axis. Columns in light gray were not evaluable for 9p24.1 genetic alterations. Additional columns are colored by 9p24.1 alterations (see key). Unbal. rearr., unbalanced rearrangement.

