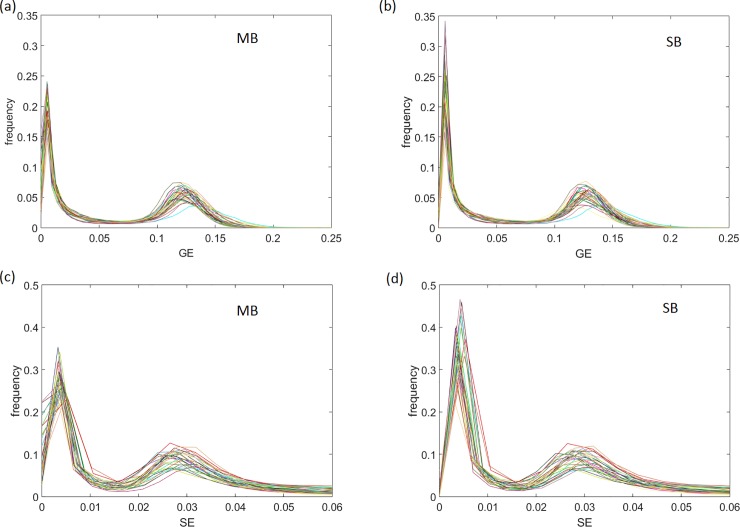
Fig 4.
Histograms of equally located image slabs for GE readout intensity using multiband (MB) (a) and singleband (SB) (b) techniques, and for SE readout intensity using MB (c) and SB (d) techniques. The averaged correlation coefficient for MB and SB histograms across all patients was found as 0.96 ± 0.03 for GE, and 0.96 ± 0.04 for SE readout intensity, respectively (N = 32).

