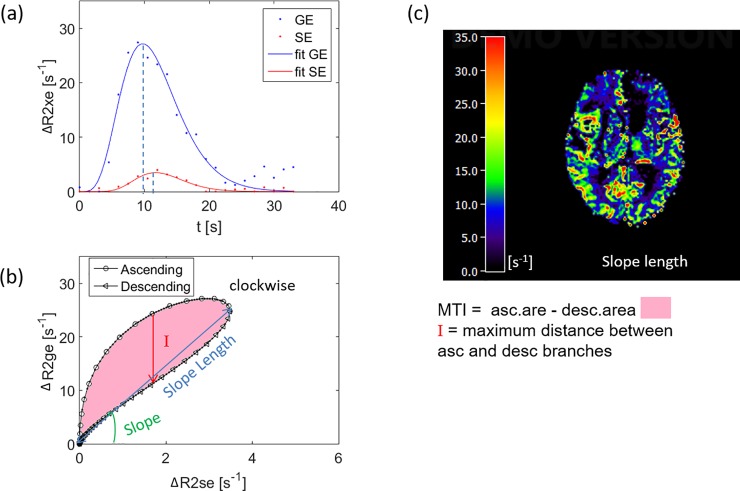
Fig 5.
(a) Relaxation rate time curves from the voxel in the region of the tumor core. The GE signal peaks earlier than the SE signal, resulting in a clockwise loop when plotting the relaxation rate curves in a point-by-point time-parametrized plot (b). (c) The slope length map visualizes the long axis of the loop. (XE = GE, SE; see also Eq (1) in the methods section).

