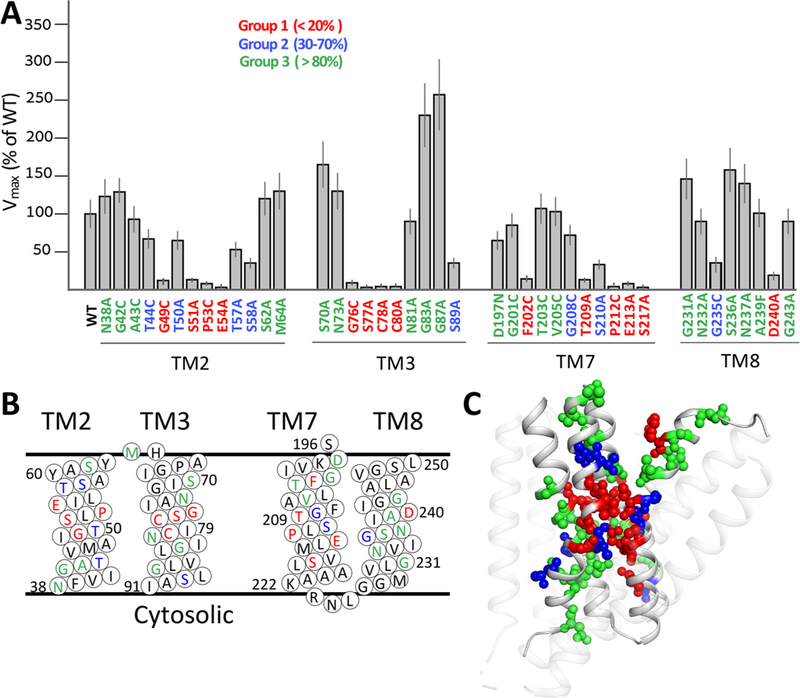
Fig. 2.

Mutational effects on the Vmax values of the Na+/Ca2+ exchange. (A) The initial rates (t = 5s) of Na+-dependent 45Ca2+-uptake were measured by using E. coli-derived vesicles containing the overexpressed protein of a given mutant or WT NCX_Mj (see Materials and Methods). The Vmax values of the Na+/Ca2+ exchange reaction were measured for NCX_Mj mutants as described in Materials and Methods. The Vmax values of the indicated mutants are presented in percentage values in comparison with WT Vmax (100%). Data are presented as bars (mean ± SE). The data were derived from at least 3 independent experiments. Residues are colored according to their mutational effects on Vmax, as indicated. (B) Topological positions of mutated residues are presented according to color assignments, described in panel A. (C) Cartoon representation of NCX_Mj. Mutated residues are shown as spheres and are displayed in color according to the mutational effect (see panel A). Note the specific distribution of residues belonging to group 1 (red) in the vicinity of the pore core.
