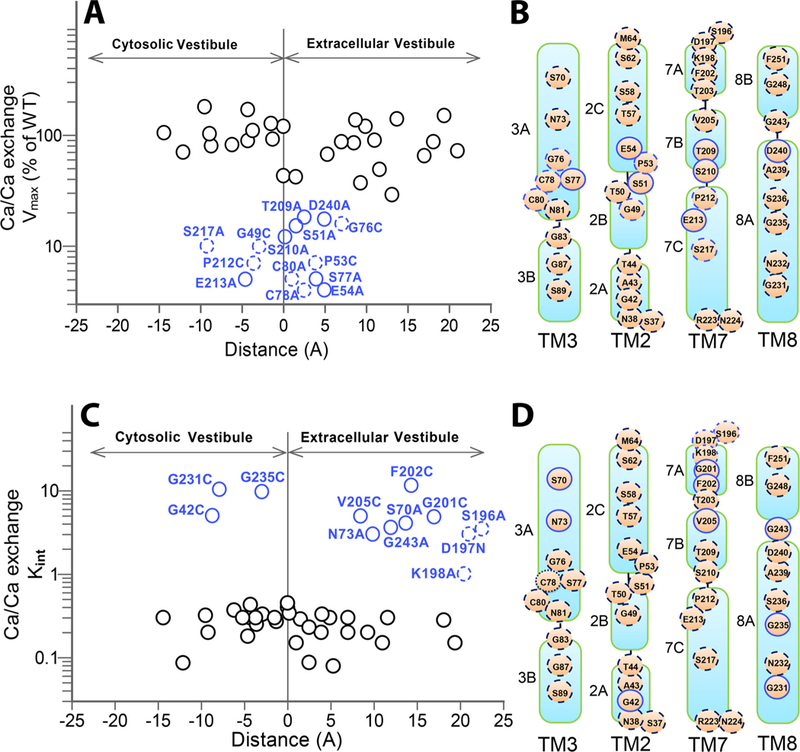
Fig. 6.

Spatial distribution of residues differentially affecting the Vmax and Kint values. (A) For each mutant, the Vmax value of the Ca2+/Ca2+ exchange was plotted vs. its position within the pore. The residue-positions are expressed as the distance from the pore center (the “zero” represents the position of the pore center). The residues significantly affecting the Vmax value (< 20% of WT Vmax) are shown in blue, where less significant residues affecting the ion-transport rates are shown as solid black circles. The solid and dashed blue circles represent the ion-coordinating and non-coordinating residues, respectively. (B) Topological presentation of mutated positions. The mutational effects of residues on Vmax are colored as in panel A. (C) For each mutant, the Kint value was plotted vs its distance from the pore center. The mutants exhibiting high Kint values are indicated in blue, whereas the solid and dashed circles represent the pore-forming and helix-loop residues, respectively. Solid black cycles represent mutations having an insignificant effect on Kit (D). Topological presentation of mutated positions are colored as in panel C.
