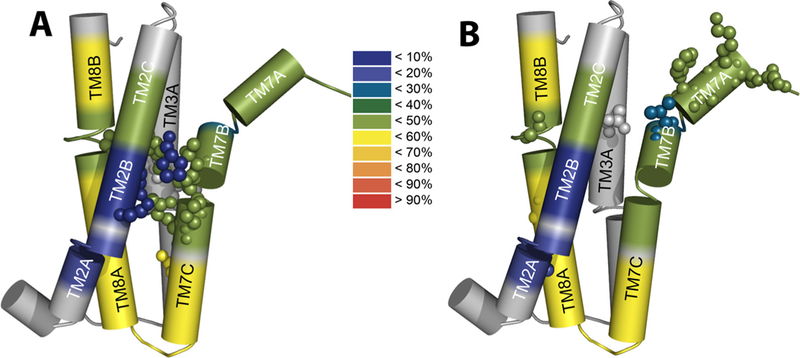
Fig. 7.

Structural-dynamics and functional relationships in NCX_Mj. Schematic heat maps of the hydrogen-deuterium exchange were overlaid on the pore-forming TMs by using the available HDX-MS data [31] and the crystal structural of NCX_Mj [12,30]. The color ruler represents the HDX levels (in %), thereby depicting the characteristic profiles of backbone dynamics in apo NCX_Mj (blue signifies the most rigid and water inaccessible segments in protein). (A) The key residues limiting the ion transport rates (shown as spheres) are located on the TM2B, TM3 A, TM7BC, and TM8 A segments within the pore core, while showing striking differences in the local backbone dynamics at respective locations. (B) Key residues affecting the intrinsic equilibrium (Kint) of bidirectional Ca2+ movements (shown as spheres) are distributed at peripheral locations on TM2 A, TM3 A, TM7AB, and TM8 AB, which is consistent with the known mechanisms of ion occlusion and also provides new clues for the mechanisms underlying ion-coupled alternating access.
