Fig. 8.

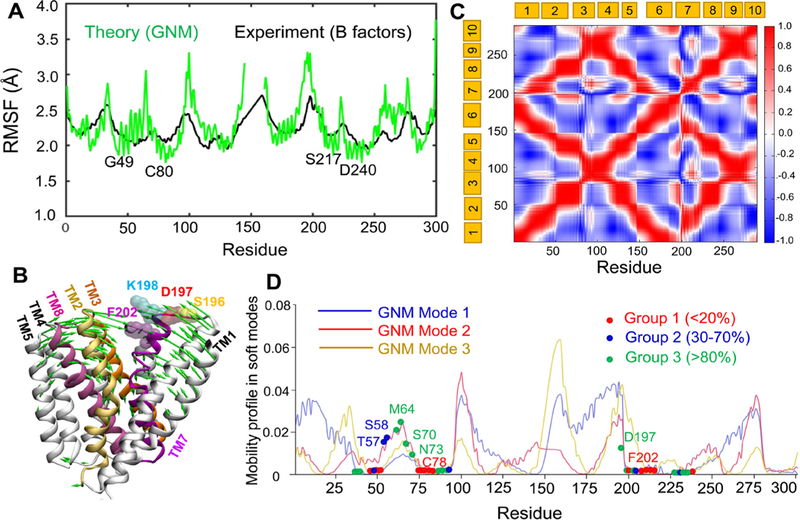
Conformational dynamics of NCX_Mj predicted by elastic network models. (A) Comparison of the theoretically predicted root-mean-square fluctuations (RMSFs) of residues (green) with the B-factors profile (black) observed in X-ray crystallographic experiments (PDB: 3V5S). (B) ANM mode 2 (green arrows) in the presence of lipid bilayer induce the closure of the extracellular vestibule, in favor of a transition from OF open state to an OF occluded state. (C) Cross-correlation map for the coupled fluctuations of all residues driven by the softest GNM modes 1–3. Red regions indicate pairs of residues undergoing correlated movements, blue regions indicate the pairs that undergo anticorrelated (coupled but opposite direction) fluctuations. Note that TM1 and TM6 are highly correlated, and they are anticorrelated with TM2–4 and TM8–9. (D) Residues in group 1 occupy minima in the mobility profile. The graph displays global mobilities of residues (corresponding to the soft modes 1, 2 and 3) obtained by GNM analysis of NCX_Mj embedded in a lipid bilayer. The blue, red and oranges curves represent the predictions from the respective three GNM modes. Red, blue and green spheres indicate the mutated residues belonging to those classified as Group 1 (Vmax < 20%), Group 2 (30 < Vmax < 70%), and Group 3 (> 80%), respectively in Fig. 2. The residues that show minimal (close to zero) mobility in at least one of the three soft modes are shown by their color-coded sphere. Those located in other regions, are indicated on the mode 2 curve. Minima refer to structural regions that serve as hinges or anchors in the global movements of the entire exchanger. All calculations and visualizations were performed using the DynOmics server.
